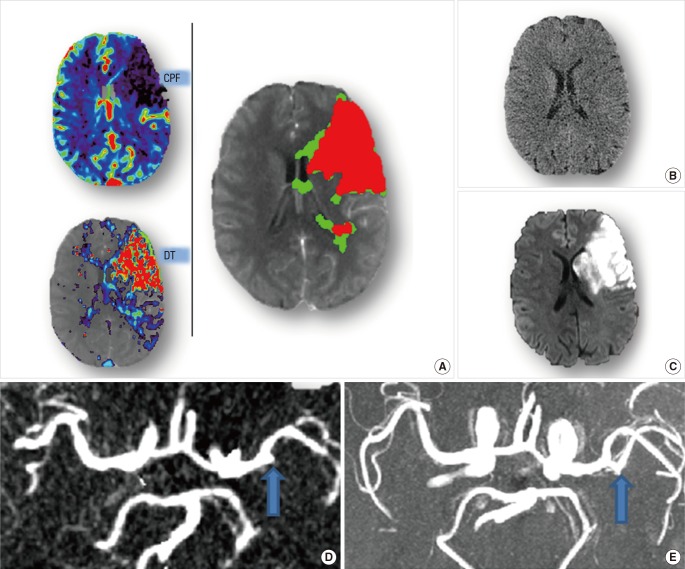
Figure 3.
Brain imaging of Case 3. Acute CTP (A) reveals a big infarct core (red) with limited penumbra (green), while no obvious abnormality is shown in acute NCCT(B). Acute CTA (D, blow arrow) shows the existence of occlusion on M2 segment of MCA. Thrombolytic treatment was given to this patient. Follow-up MRA (E, blow arrow) confirms the recanalization of the occlusion. Follow-up DWI (C) shows a big infarct consistent with the pre-treatment CTP core map.

