Figure 5.
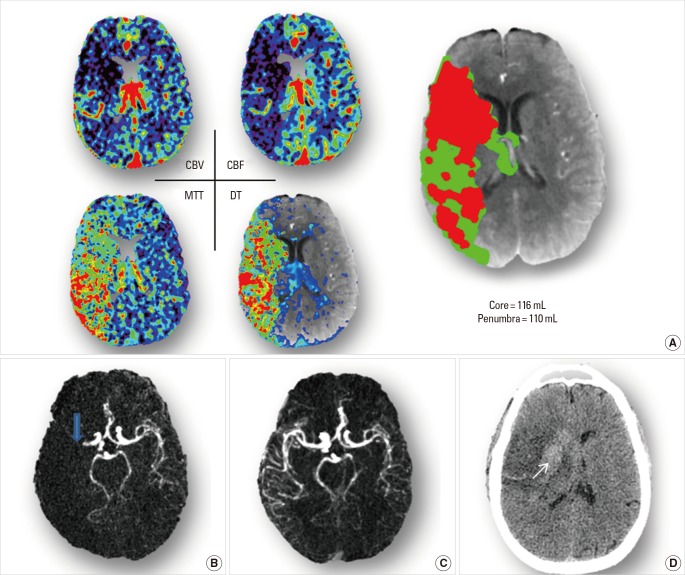
Brain Imaging of Case 5. (A) acute CTA shows on the whole right MCA territory with decreased CBV and CBF, and prolonged MTT and DT. By adding up whole brain lesion volumes, core (red area) results a volume of 116mL, and penumbra (green are) has a volume of 110 mL. (B) acute CTA reveals occlusion of the M1 segment of right MCA (blue arrow). (C) Follow-up CTA reveals the recanalization of right MCA. (D) Follow-up NCCT shows a big infarct (consistent with baseline core maps), with midline shift to the left. Inside of the lesion, there is hemorrhagic transformation (white arrow).

