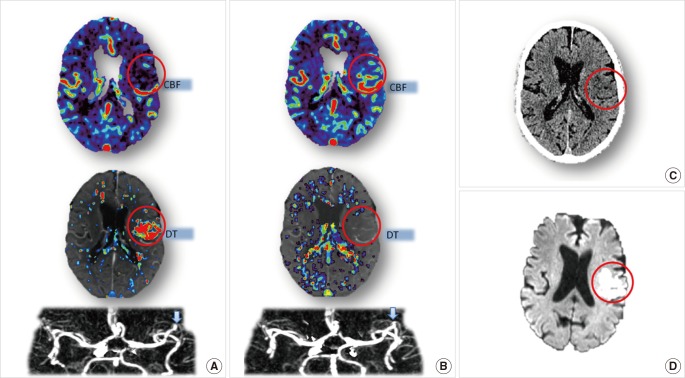
Figure 8.
Cerebral Images of Case 8. (A) Acute CTP shows decreased CBF and DT on left MCA territory due to occlusion of M2 segment (blue arrow). (B) 24-hour CTP shows CBF and DT returns to normal level due to recanalization of occluded artery. (C, D) 24-hour NCCT and 24-hour DWI confirm that cerebral tissues are infarcted in reperfused area (red circle).

