
Figure 4.
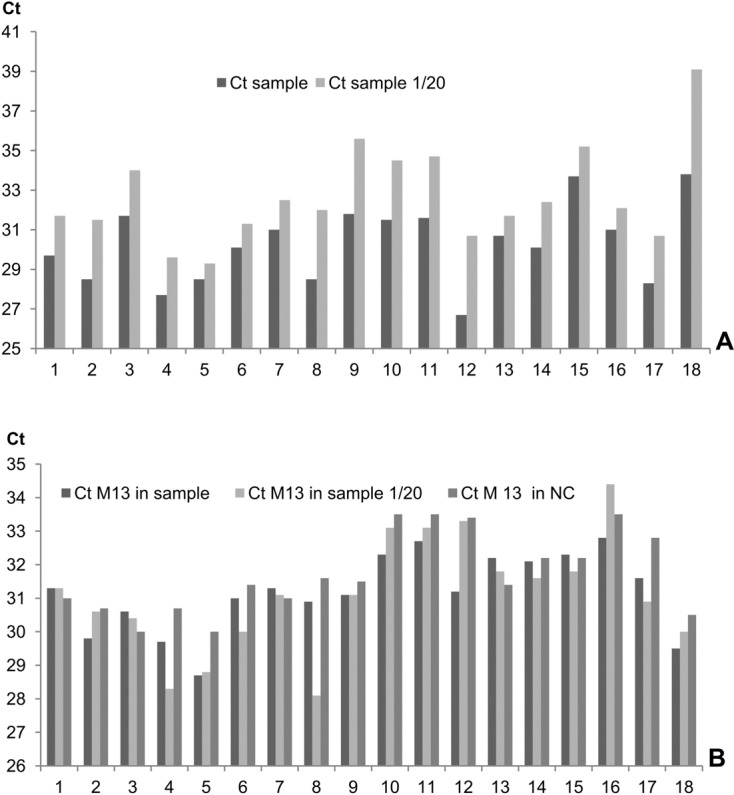
Identification of PCR inhibitors in 18 biological samples positive for Aspergillus. Graph A: Ct values obtained from pure and diluted DNA samples (dilution rate 1/20). Graph B: Ct values obtained with 20 copies of a plasmid DNA systematically added to the same biological samples (undiluted and diluted) and a negative control sample (NC).