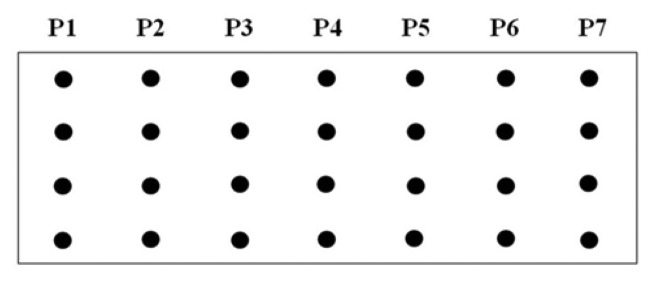
Figure 2.

Schematic depicting the DNA capture probe grid across the slide from probe one to seven (P1–P7) displaying four consecutive repetitions for each probe. In order of appearance, for P1 (EU7486), P2 (EU7529), P3 (AF7496), P4 (AF7530), P5 (AA7486), P6 (AA7496), and P7 (AA7529/7530).
