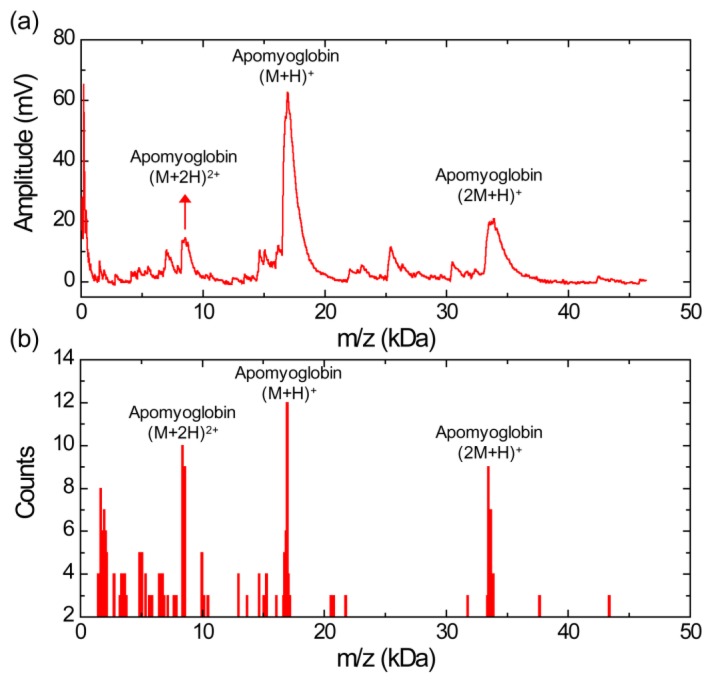
Figure 2.
(a) MALDI-TOF mass spectrum for apomyoglobin with sinapinic acid matrix obtained using silicon nanomembrane detector, showing singly charged ion, doubly charged ion, and singly charged dimer ion. (b) Histogram of the MALDI-TOF mass spectrum, showing a relative abundance of apomyoglobin ions in the sample under test.

