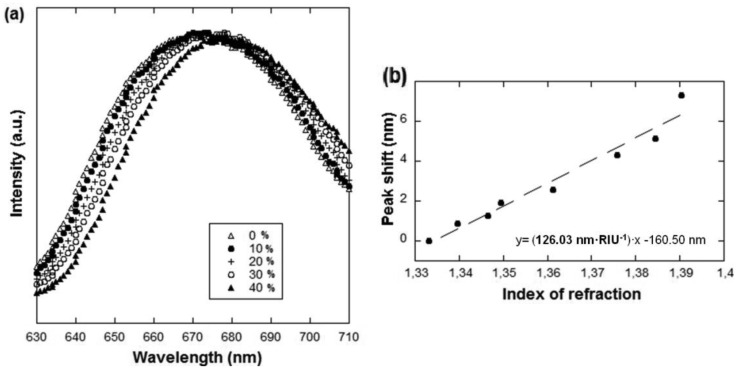
Figure 6.
(a) Transmission spectra obtained for four sucrose solutions at different concentrations (see inset). A clear red shift with increasing concentration (or refractive index) can be observed; (b) Linear change of the peak wavelength position vs. solution refractive index. From this plot, a 126 nm/RIU sensitivity was obtained.

