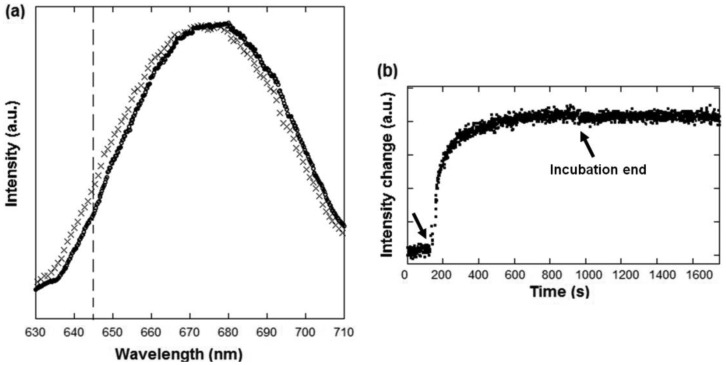
Figure 7.
(a) Transmission spectra through a gold nanohole array (that of Figure 3) in contact with PBS buffer (crosses) and after 1 h incubation of a solution of 50 μg/mL BSA solution in PBS buffer (circles). The peak wavelengths λSP are 673.1 nm and 675.9 nm respectively (b) Real-time label-free monitoring of the BSA absorption on the gold surface. The transmission intensity was monitored at a wavelength situated in the high-slope region of the peak (λ = 645 nm, see vertical line in (a)) for maximum sensitivity and linearity. The injection of BSA protein (arrow at t = 150 s) results in a change of the transmitted spectra which can be measured as an intensity change at a given wavelength. It can be observed that at after 800 s the surface was saturated with BSA and no further absorption took place. At t = 950 (see arrow) the buffer was switched back to PBS and no signal decrease was appreciable, proving the stability of the formed BSA layer.

