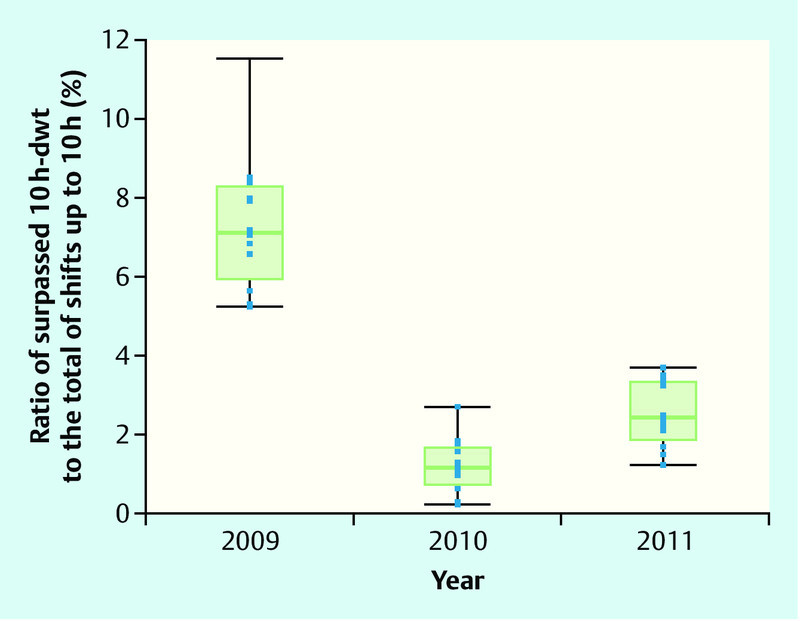
Fig. 3.

Percentage of surpassed 10 h daily working time (10 h-dwt) in relation to the total of shifts with a length up to 10 h for each month of the years 2009 to 2011 (after implementation of the new shift model). Significant decline from 2009 to both, 2010 and 2011. Significant increase from 2010 to 2011.
