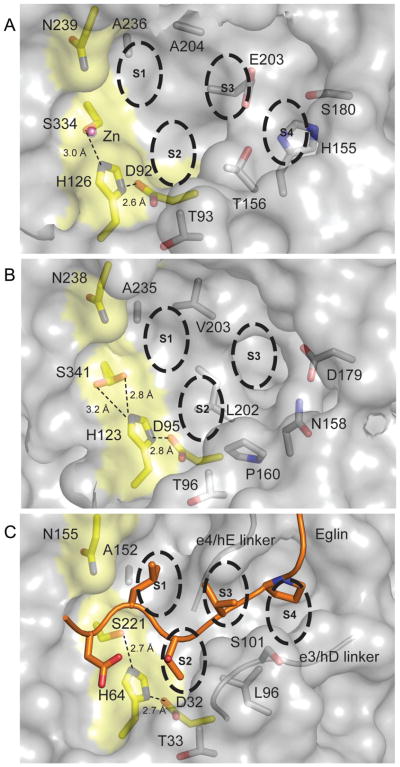
Fig. 5. Catalytic triad and binding grooves of MycP1mth, MycP3msm and subtilisin Carlsberg/eglin complex.
A. The surface of MycP1mth is shown in gray with residues of the catalytic triad and Asn239 highlighted in yellow. Zinc ion is shown as a pink sphere. The substrate recognition subsites and important residues are labeled explicitly. Distances between catalytic triad side chains are shown as dashed lines. Residues 242, and 320–329 of MycP1mth (loop 3) were not displayed for clarity.
B. MycP3msm is represented in the same way as (A). Residues 326–335 of MycP3msm (loop 3) were omitted for clarity.
C. Subtilisin Carlsberg/eglin complex (PDB 2SEC) (McPhalen and James, 1988) represented as in (A). Only eglin residues 53–61 are shown as cartoon with side chains at P4–P1′ positions shown as sticks. The glycine/serine rich linker strands (residues 99–103 and 126–130) that make backbone interactions with eglin are shown as cartoons. Subtilisin side chains close enough to interact with eglin are shown as sticks within the surface and labeled explicitly.

