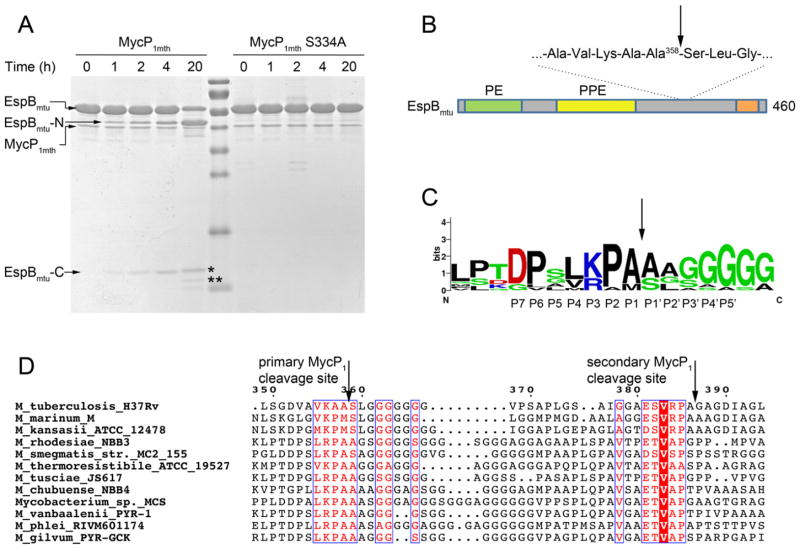
Fig. 7. EspBmtu is processed by MycP1mth in vitro.
A. EspBmtu samples were incubated with MycP1mth or catalytically inactivated variant MycP1mth S334A for indicated time periods and analyzed by SDS-PAGE. The cleavage leads to accumulation of the N-terminal fragment (EspBmtu-N) and two C-terminal fragments (EspBmtu-C) indicated by asterisks.
B. A schematic diagram of the domain structure of EspBmtu with predicted PE and PPE domains. The C-terminal homology region is indicated by an orange bar (Supplementary Fig. S6). The primary and secondary MycP1 cleavage sites are located in the low complexity region of EspBmtu.
C. The sequence conservation of the primary MycP1 cleavage site is displayed as a sequence logo (http://weblogo.berkeley.edu) (Crooks et al., 2004) based on the sequence alignment of EspB homologs shown in (D).
D. Sequence alignment of EspB homologs from the ESX-1 clusters with the primary and secondary MycP1 cleavage sites indicated by vertical arrows. The full-length alignment is shown in Supplementary Fig. S6.

