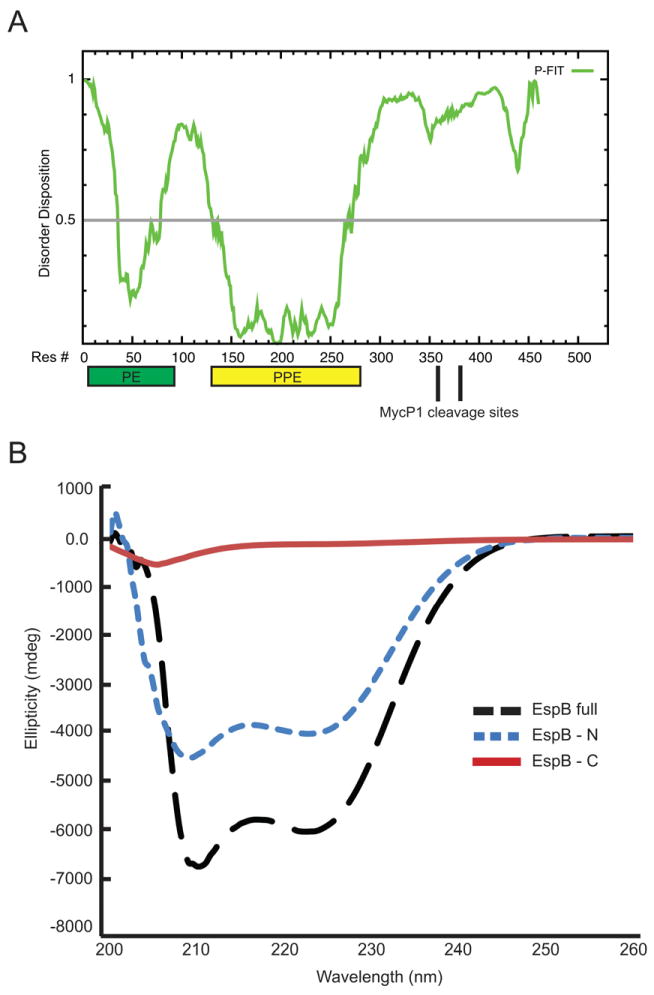
Fig. 8. Comparison of the relative secondary structure in EspBmtu, EspBmtu-N and EspBmtu-C.
A. Disorder predictions for EspBmtu with location of the predicted PE and PPE domains indicated by rectangles.
B. CD spectra of EspBmtu (black long dashed line), EspBmtu-N (blue short dashed line) and EspBmtu-C (red solid line). Data are expressed as molar ellipticity. EspBmtu-N (residues 1–358) was produced recombinantly and EspBmtu-C was obtained as a mixture of two proteolytic fragments (residues 359–460 and 387–460) as described in Methods.

