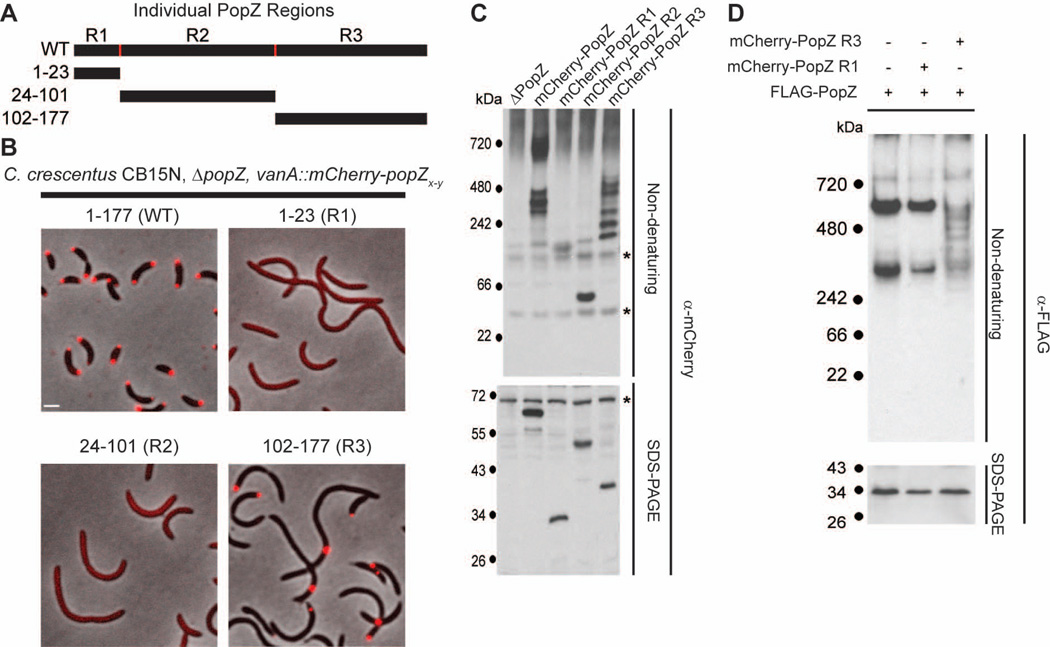
Figure 2.
The C-terminal region of PopZ is sufficient for sub-cellular localization and oligomer formation.
A. Schematic of individual PopZ regions.
B. Images of strains expressing full length mCherry-PopZ (GB1078), mCherry-PopZ R1 (GB1079), mCherry-PopZ R2 (GB1080), and mCherry-PopZ R3 (GB750) in a ΔpopZ background. mCherry fluorescence (red) overlays the phase contrast image (grayscale). Bar = 1 µm.
C. Electrophoretic migration of individual PopZ regions. Whole cell lysates of strains expressing no PopZ (GB255), mCherry-PopZ (GB1078), mCherry-PopZ R1(GB1079), mCherry-PopZ R2 (GB1080), and mCherry-PopZ R3 (GB750) were resolved on native and denaturing gels, then probed with anti-mCherry sera by immunoblotting. Cross-reactive bands are indicated by an asterisk.
D. Electrophoretic migration of co-expressed PopZ variants. A PopZ-FLAG fusion was expressed by itself (GB135) and in parallel with either mCherry-PopZ R1 (GB757) or mCherry-PopZ R3 (GB758). Whole cell lysates were resolved on native and denaturing gels, then probed with anti-FLAG sera by immunoblotting.

