Figure 6.
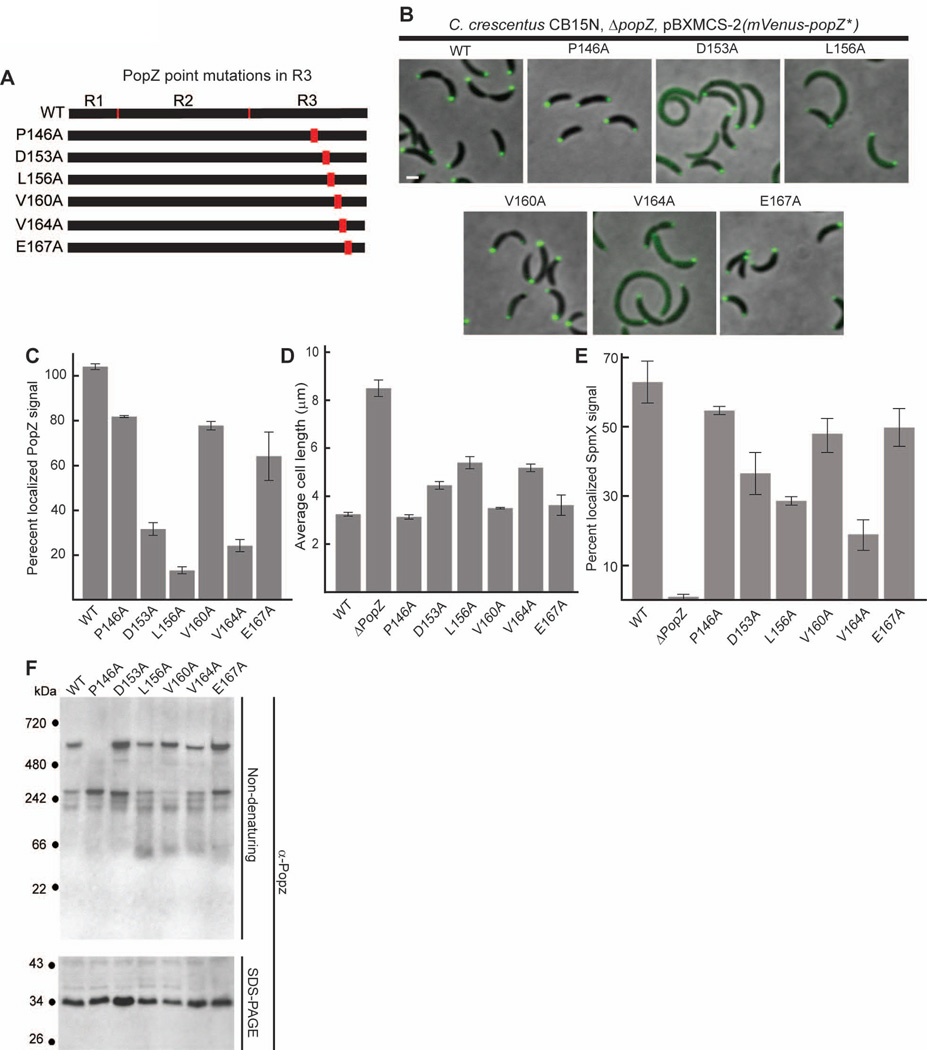
Amino acid substitutions in the C-terminal R3 region of PopZ affect both localization and oligomer formation.
A. Schematic of C-terminal PopZ amino acid substitutions.
B. Images of strains expressing mVenus-PopZ (AP323) (WT), mVenus-PopZ P146A (AP306), mVenus-PopZ D153A (AP308), mVenus-PopZ L156A (AP309), mVenus-PopZ V160A (AP310), mVenus-PopZ V164A (AP311), and mVenus-PopZ E167A (AP312) in a ΔpopZ background.
C. Percent of polar localized PopZ signal in B. D. Average cell length of strains expressing WT PopZ (GB699), no PopZ (GB255), PopZ P146A (GB890), PopZ D153A (GB892), PopZ L156A (GB893), PopZ V160A (GB894), PopZ V164A (GB895), and PopZ E167A (GB896) in a ΔpopZ background.
E. Percent of polar localized SpmX-mCherry signal in PopZ variant strains. Strains in B are modified to express SpmX-mCherry from the chromosomal spmX promoter. Data from AP253, AP236, AP283, AP285, AP286, AP287, AP288, and AP289 are presented. Corresponding images are in Supplementary Figure S5.
F. Electrophoretic migration of PopZ N-terminal mutant proteins. Whole cell lysates of strains in panel D were resolved on native and denaturing gels, then probed with anti-PopZ sera by immunoblotting.
In images, Bar = 1µm. In graphs, error bars represent SEM from 2 separate experiments of 30–60 cells each.

