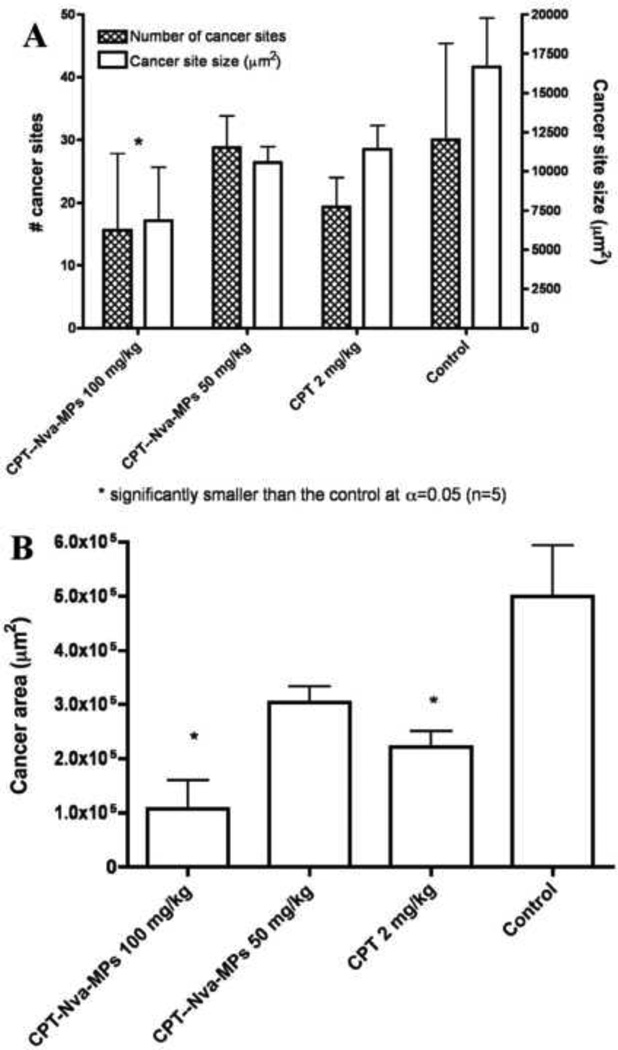
Figure 9.
Summary of the anti-cancer efficacy results of all of the treatment groups (CPT-Nva-MPs 100 mg/kg (eq. CPT 0.22 mg/kg), CPT-Nva-MPs 50 mg/kg (eq. CPT 0.11 mg/kg), free CPT 2 mg/kg, and control (normal saline containing 0.1% Tween 80). (A) the average number (shaded bar) and average size (empty bar) of cancer sites found in lung tissue slides with complete cross section from rats receiving different treatment groups. (B) The total area occupied by cancer cells found in lung tissue slides from rats receiving different treatments. Bars represent mean±standard error of the mean (n=5).

