
Figure 4.
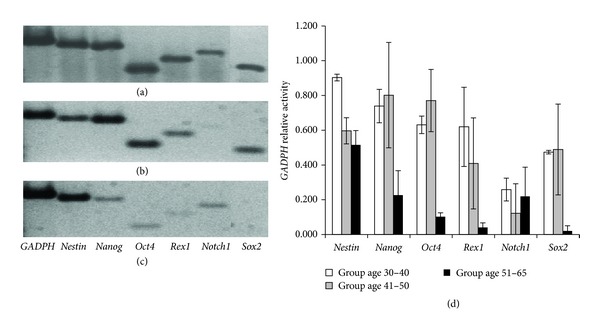
Gene expression analysis. The upper image shows a representative agarose gel electrophoresis showing the expression of selected stem cell genes from the following donor age groups: (a) 30–40 years old, (b) 41–50 years old, and (c) 51–65 years old; (d) shows the average of the GADPH relative gene expression and the error bars indicate the standard deviation in samples from the same age group.