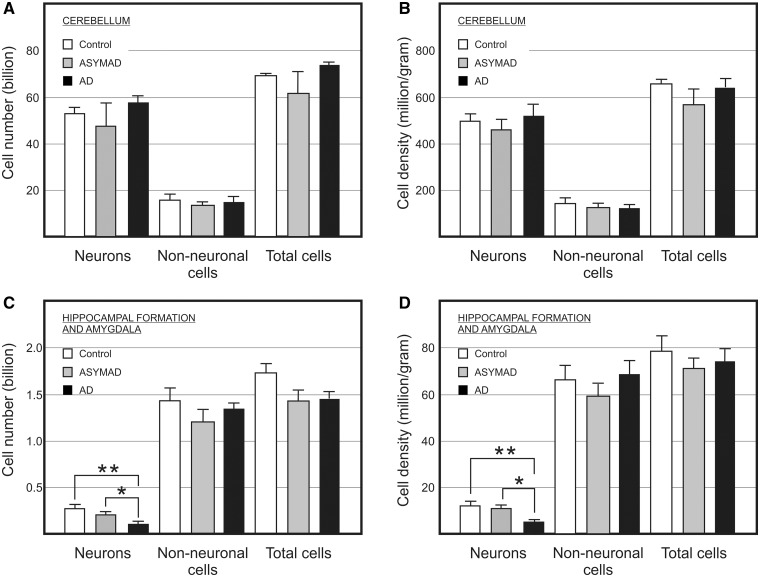
Figure 3.
Absolute bilateral cell number (A and C) and density (B and D) of cerebellar (A and B) and hippocampal formation (C and D) neuronal, non-neuronal, and total cells in control, asymptomatic Alzheimer’s disease (ASYMAD) and demented Alzheimer’s disease (AD) groups. Each bar represents mean and standard deviation. Significant differences are indicated by *P < 0.05, **P < 0.01.

