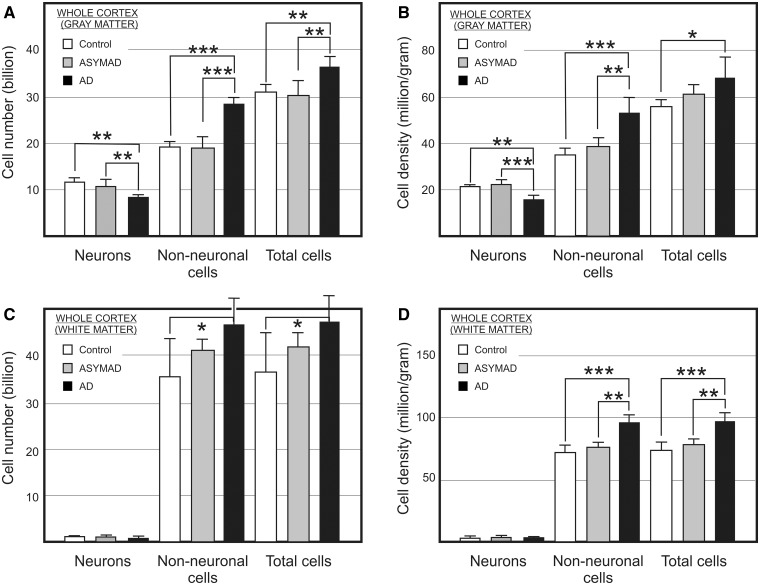
Figure 5.
Absolute bilateral cell number (A and C) and density (B and D) for neuronal, non-neuronal, and total cells in the grey (A and B) and white (C and D) matter of the entire cerebral cortex from control, asymptomatic Alzheimer’s disease (ASYMAD) and demented Alzheimer’s disease (AD) groups. Each bar represents the mean and standard deviation. Significant differences are indicated by *P < 0.05, **P < 0.01, and ***P < 0.001.

