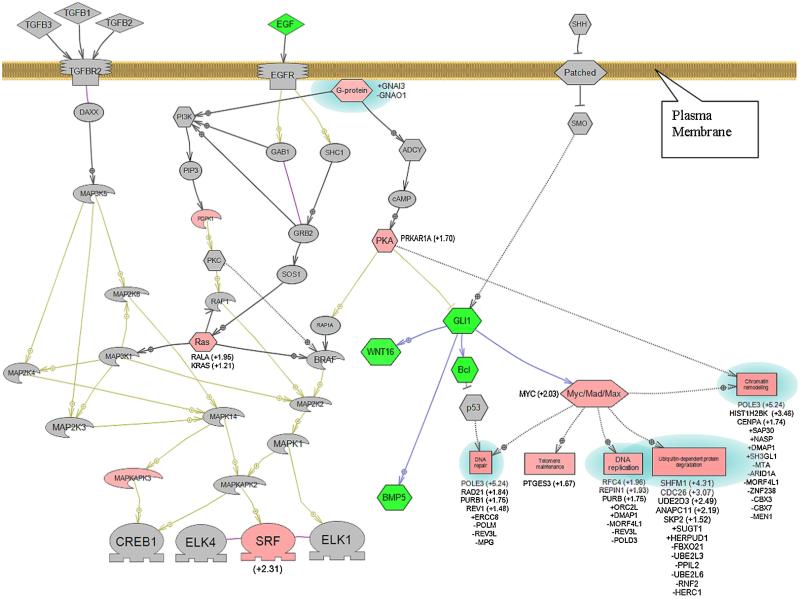
Figure 5.
Network map of key signaling pathways associated with PDAC and encoded by differentially expressed mRNA from polysomes of SMAD4−/− versus SMAD4+ BxPC3 cells. Pink shapes represent mRNAs expressed at relatively higher levels, those in green at relatively lower levels, and those in gray are not differentially expressed (P-value ≤0.05). Proteins and biological processes with blue halos represent a set of genes in a biological process that include genes expressed at both relatively higher and lower levels. Values in parentheses represent relative changes in RNA levels of greater than 1.2-fold. Fold changes less than 1.2-fold are represented with a + or − sign preceding the gene symbol. Hexagon, signaling protein; Rectangle, biological process; Diamond, ligand; Oval, small molecule; Boomerang, kinase;  , receptor;
  , transcription factor. [Color figure can be seen in the online version of this article, available at http://wileyonlinelibrary.com/journal/mc]

