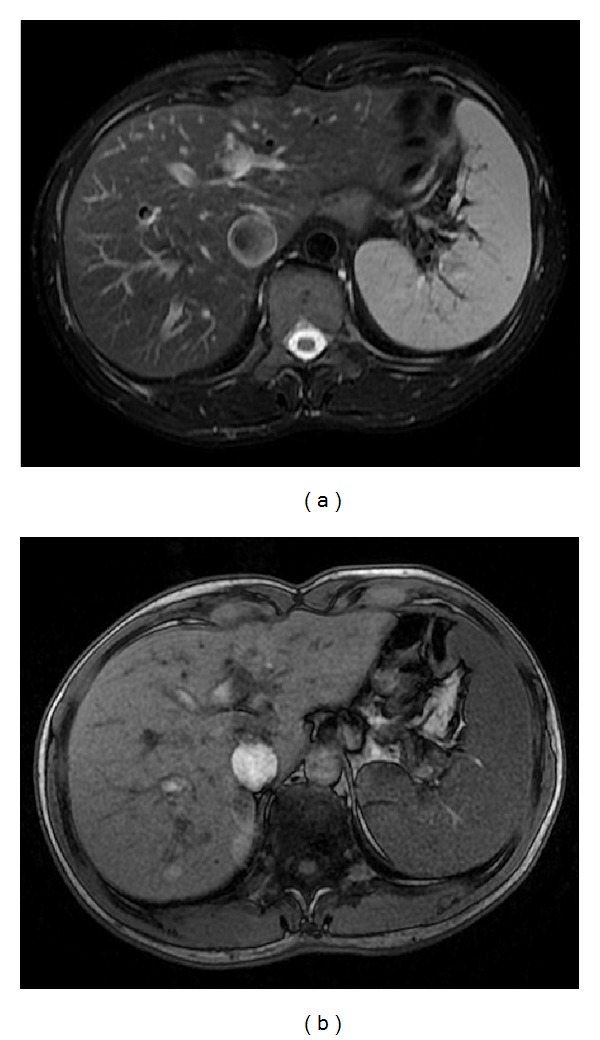
Figure 1.

The normal spleen. Axial T2wi FSE with fat suppression (a) and axial T1wi out-of-phase GRE (b). The spleen shows the typical coffee bean configuration. On T1wi (b), the normal signal intensity of the spleen is lower than that of hepatic tissue. Conversely, on T2wi, the spleen shows higher signal intensity.
