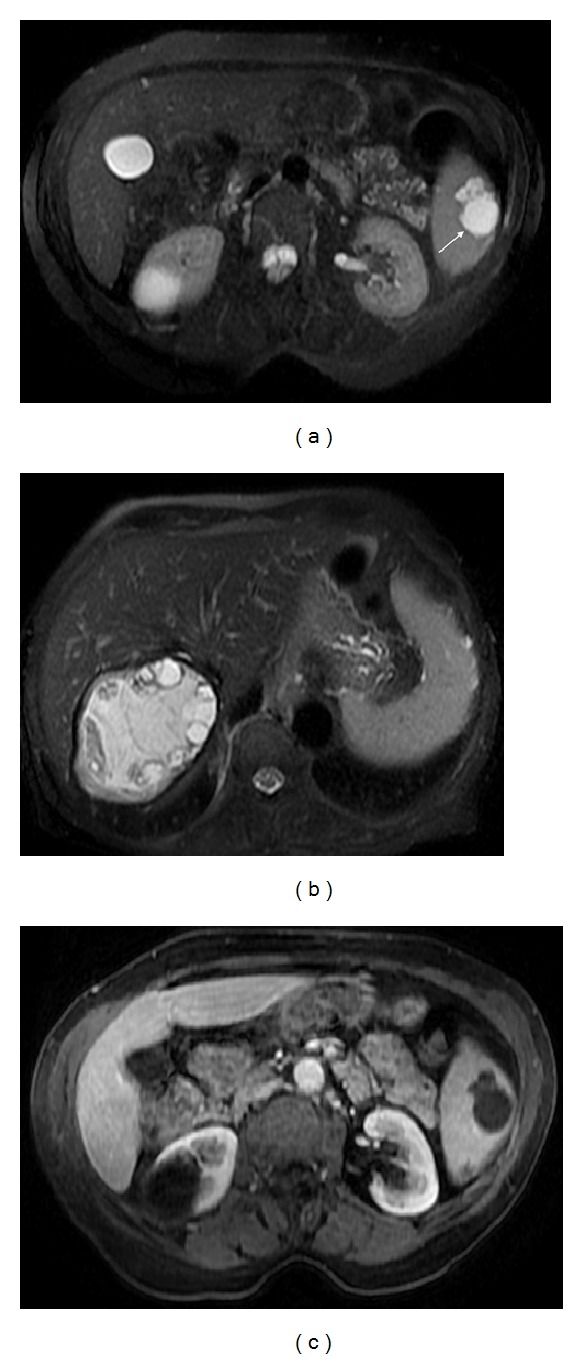
Figure 12.

Hydatid cyst. Axial T2wi SSFSE with fat suppression ((a) and (b)) and axial postcontrast T1wi 3D-GRE with fat suppression in the venous (c) phase. A classic hydatid cyst is visualized in the liver (b). A concomitant splenic hydatid cyst is depicted as a multilocular lesion with moderate hyperintensity on T2wi (arrow, (a)) and hypointensity on T1wi (c). A fibrotic thickened continuous low signal intensity rim surrounding the cyst is seen on T2wi ((a), (b)). No enhancement is noted following IV contrast administration (c).
