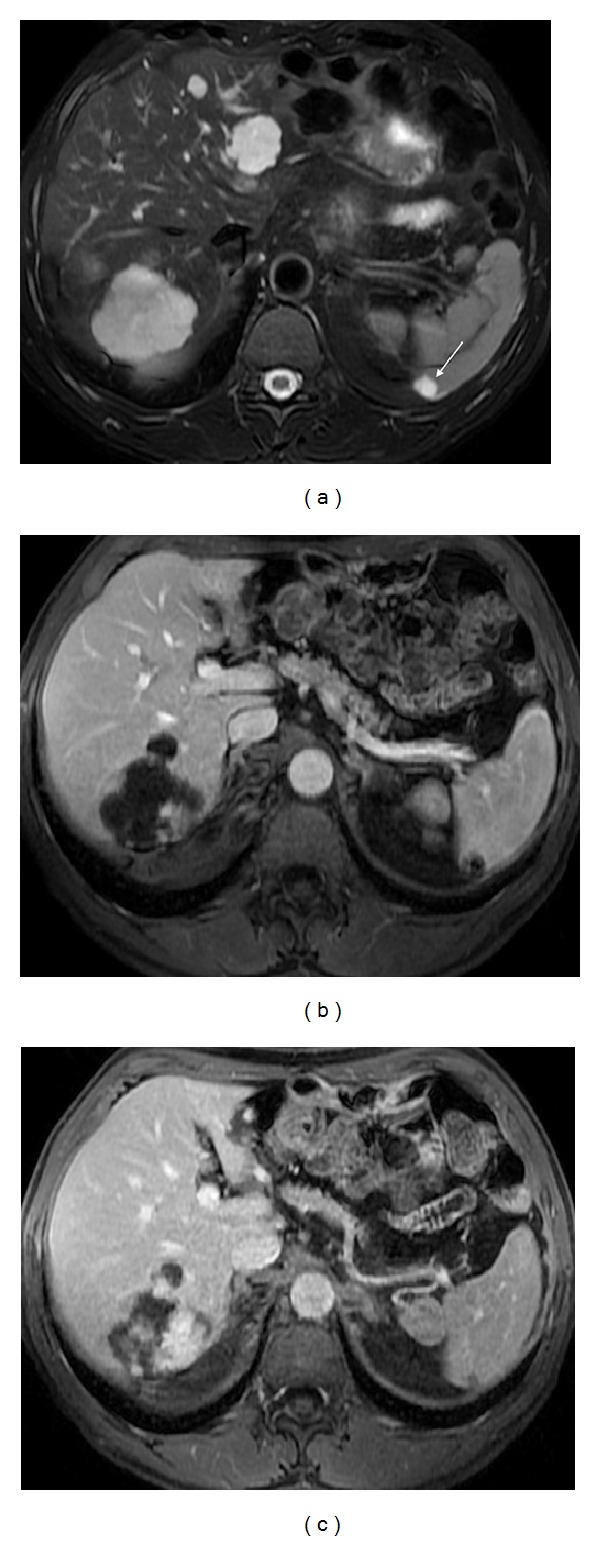
Figure 13.

Splenic hemangioma. Axial T2wi FSE with fat suppression (a) and postcontrast axial 3D-GRE T1wi with fat suppression at the arterial (b) and interstitial (c) phases. The hemangioma is depicted as a well-defined, homogeneous, and hyperintense lesion on T2wi (arrow, (a)), with a peripheral enhancement with centripetal and delayed progression, on postcontrast images ((b) and (c)). Note the hepatic hemangiomas on the same imaging plane.
