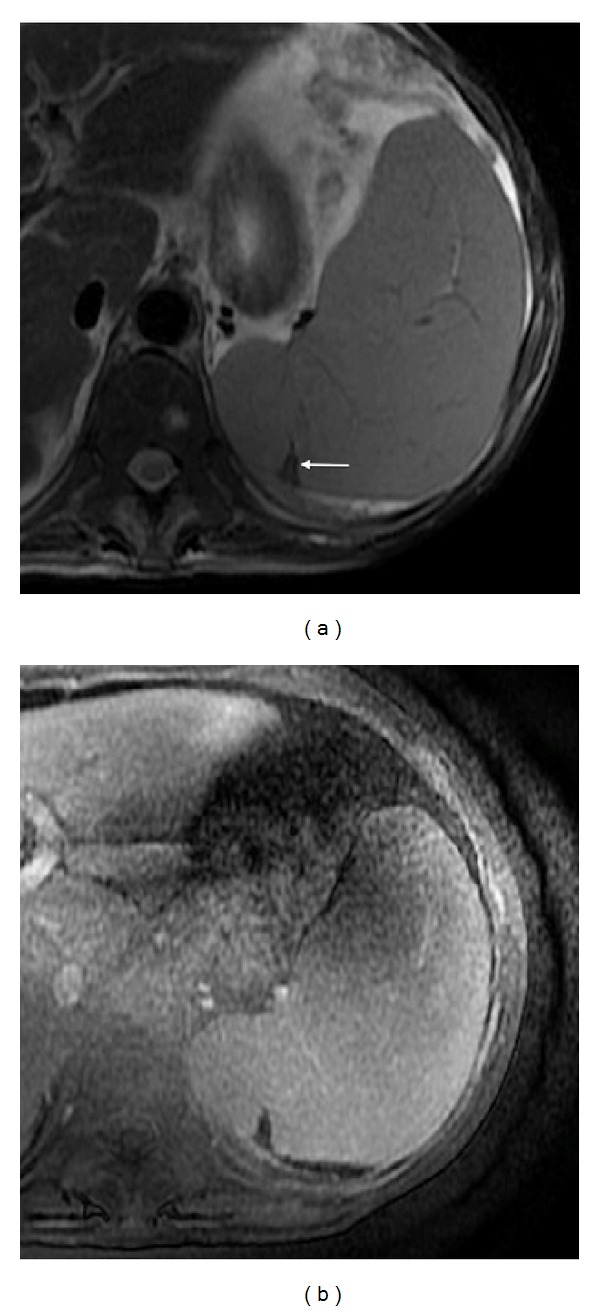
Figure 9.

Splenic infarct. Axial T2wi FSE (a) and axial postcontrast fat-suppressed 3D-GRE T1wi at the venous (b) phase. A small triangular wedge-shaped area at the periphery of the spleen is noted (arrow, (a)), with hypointensity signal on both T1 and T2wi, with no enhancement on postcontrast images.
