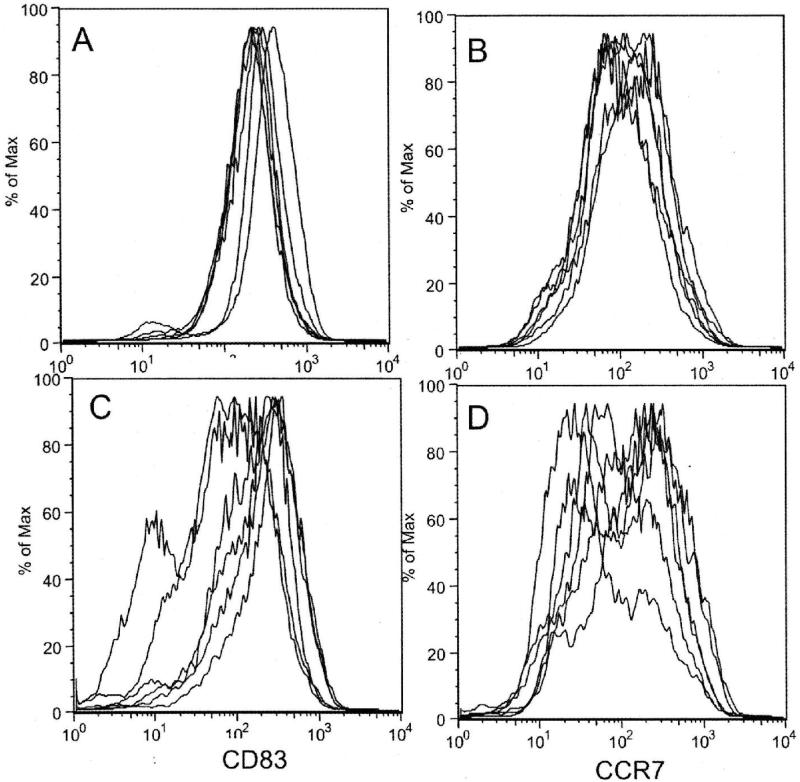
Figure 2.
Overlay flow cytometric plots from 6 independent experiments comparing CD83 (panels A and C) and CCR7 (panels B and D) expression by LPS/IFNγ-treated DCs prepared after 3 days (Panel A and B) or 7 days (Panel C and D) of culture in GM-CSF and IL4. Mature DCs generated after 3 days of initial culture typically demonstrated a single dominant peak of antigen expression, whereas those generated after 7 days of initial culture often showed shoulders or second peaks, indicating populations with lower levels of antigen expression.

