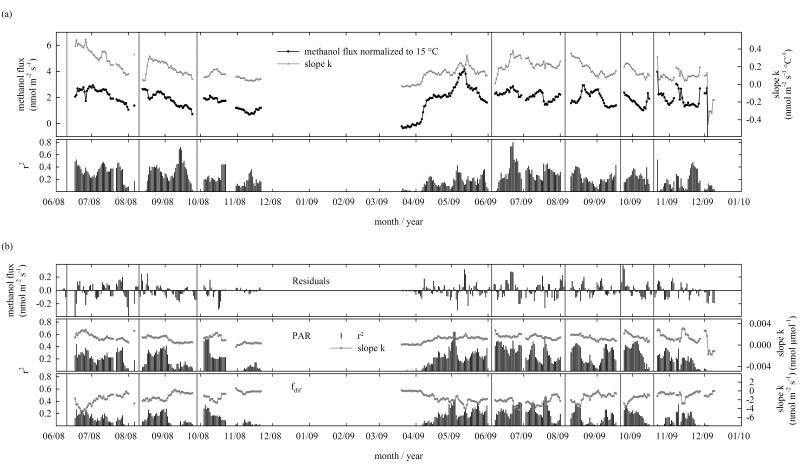
Figure 5. Seasonal and interannual variability in the temperature sensitivity of the methanol flux for moving time windows of 7 days, with each following data point being shifted by one day.
(a) Methanol flux normalized to an air temperature (Tair) of 15 °C, the slope of a linear regression between air temperature and the log-transformed methanol flux (k) and r2 which shows the variance of the observed methanol flux that can be explained by Tair. (b) The residuals show the difference between the observed and the predicted (based on Tair) flux, while r2 shows to what extent the observed variance of the residuals can be explained in a linear regression by photosynthetically active radiation (PAR) or fraction of diffuse radiation (fdif), other independent variables were not significant. Vertical lines show management dates.

