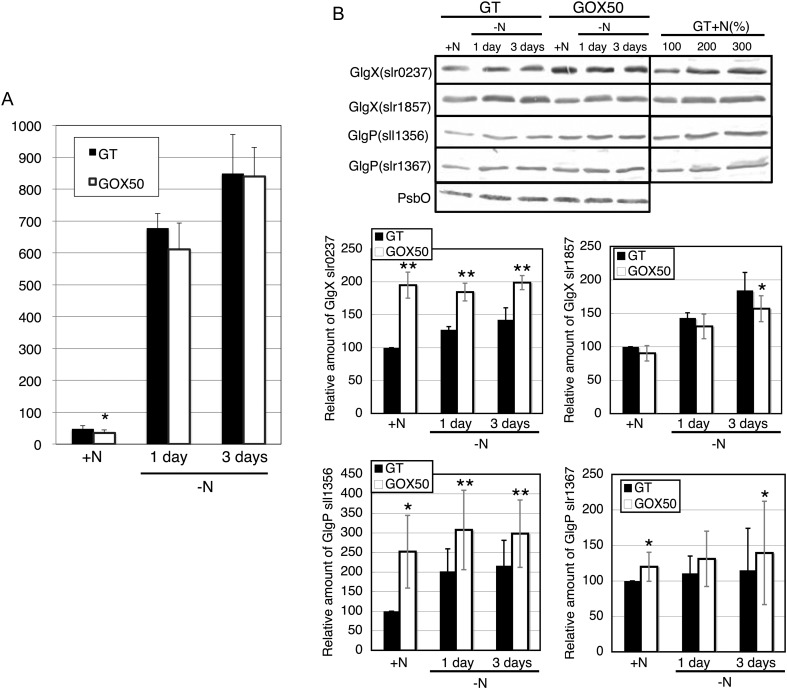
Figure 2.
Levels of glycogen and glycogen catabolic proteins. (A) Levels of glycogen in the GT and GOX50 strains. Data represents mean ± SD results from five independent experiments. Glycogen levels were calibrated relative to that of the GT strain under nitrogen-replete conditions (set at 100%). Statistically significant differences between GT and GOX50 are marked by asterisks (Student's t-test; *P < 0.05). (B) Levels of GlgX (Slr0237 and Slr1857) and GlgP (Sll1356 and Slr1367) in the GT and GOX50 strains (total protein 14 μg). Bands show the relative expression of the four proteins for the two strains under nitrogen-replete conditions (+N) and after 1 and 3 days of nitrogen depletion (−N). Data represent mean ± SD results from five to seven independent experiments. Protein levels were calibrated relative to that of the GT strain under nitrogen-replete conditions (set at 100%).

