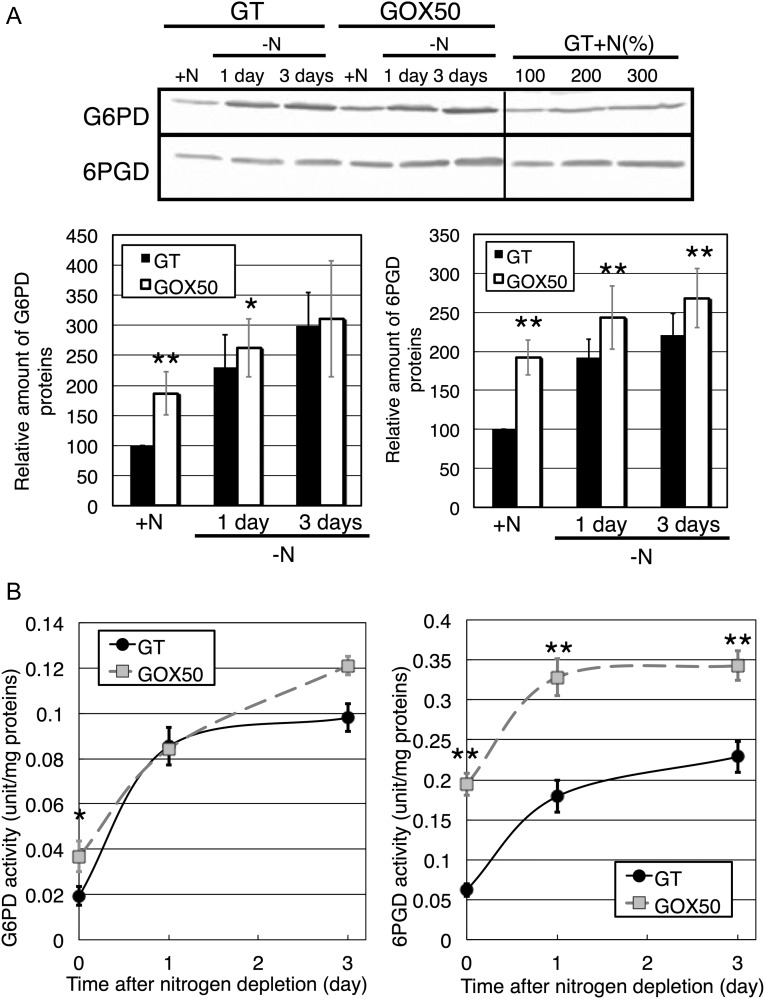
Figure 3.
(A) Levels of G6PD and 6PGD in the GT and GOX50 strains under nitrogen-limited conditions, assayed by immunoblotting (total protein 12 μg). Bands show the relative expression of the two proteins under nitrogen-replete conditions (+N) and after 1 and 3 days of nitrogen depletion (−N). Data represent mean ± SD results from six independent experiments. Protein levels were calibrated relative to that of the GT strain under nitrogen-replete conditions (set at 100%). Statistically significant differences between GT and GOX50 are marked by asterisks (Student's t-test; *P < 0.05, **P < 0.005). (B) Enzyme activities of G6PD and 6PGD under nitrogen-replete and -depleted conditions. Data represent mean ± SD of values from three independent experiments.

