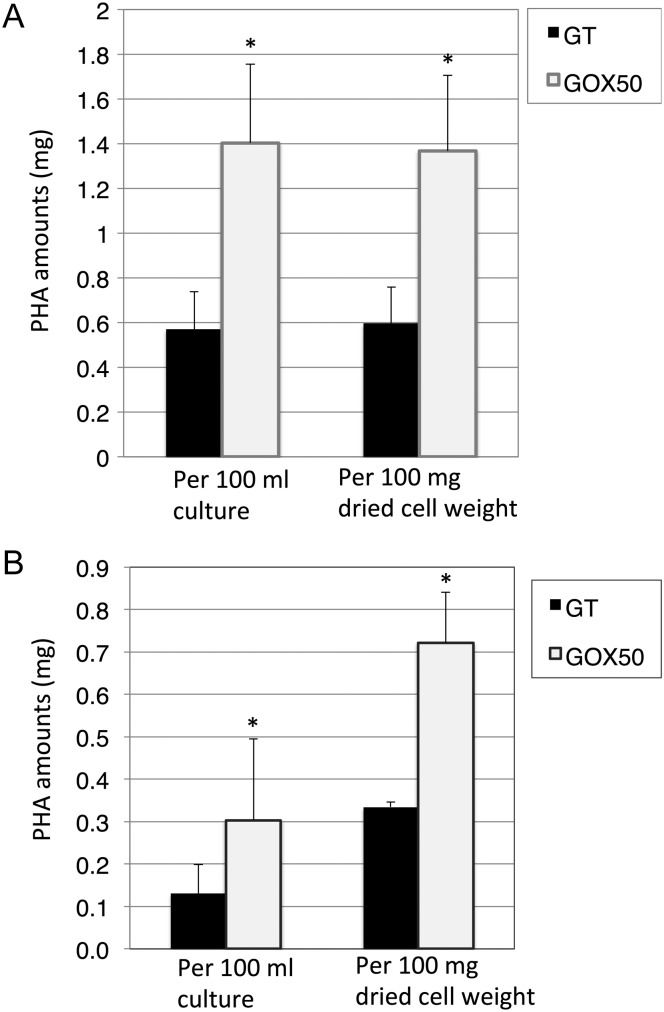
Figure 5.
Quantification of purified PHAs from GT and GOX50 cells which (A) nitrogen sources were naturally exhausted and (B) transferred into nitrogen-free medium by filtration. Data represent mean ± SD from independent experiments (n = 3–6). Statistically significant differences between GT and GOX50 are marked by asterisks (Student's t-test; *P < 0.05). PHA weight per 100 ml culture (left) and per 100 mg dried cell weight (right).

