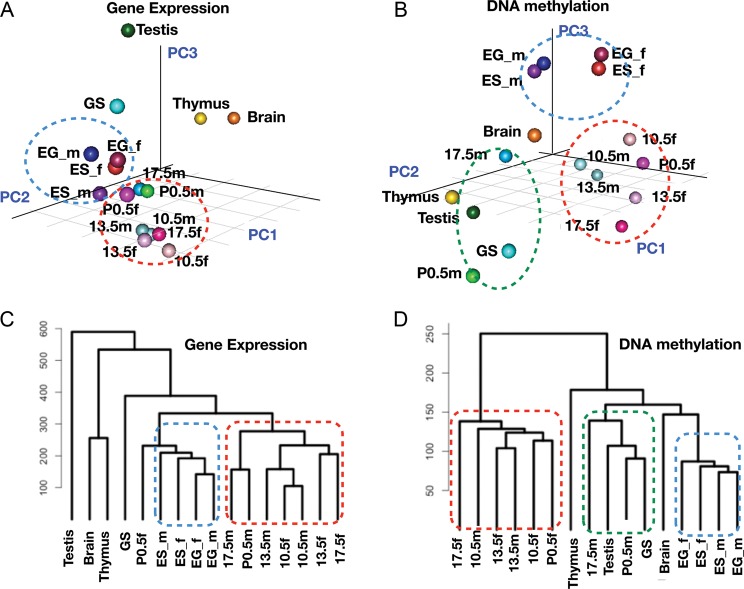
Figure 1.
Profiling of gene expression and DNA methylation in germ cells and stem cells. (A) PCA of the expression profiles of germ cells, stem cells and adult organs. ES_m (male ES cells), ES_f (female ES cells), EG_m (male EG cells), EG_f (female EG cells), 10.5m (PGCs from male E10.5 embryos), 10.5f (female E10.5 PGCs), 13.5m (male E13.5 PGCs), 13.5f (female E13.5 PGCs), 17.5m (male E17.5 PGCs), 17.5f (female E17.5 PGCs), P0.5m (spermatogonia from P0.5 neonates), P0.5f (oocytes from P0.5 neonates) and GS cells. Testis, thymus and brain were isolated from male adult mice. (B) PCA analysis of DNA methylation profiles of germ cells, stem cells and adult organs. (C) Hierarchical clustering of gene expression profiles. (D) Hierarchical clustering of DNA methylation profiles.

