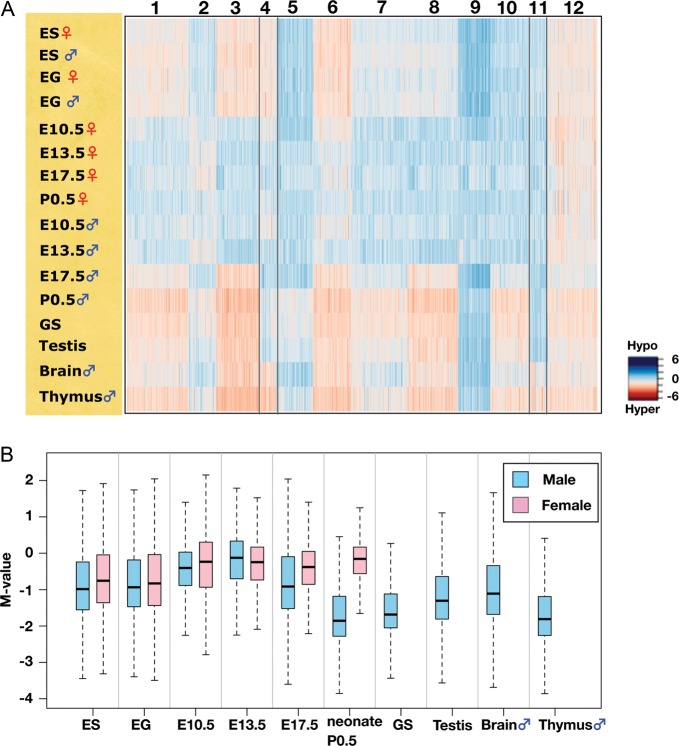
Figure 2.
DNA methylation dynamics during germ cell development. (A) k-means clustering of DNA methylation profiles of germ cells, stem cells and adult organs. DNA methylation levels of the CCGG segments are represented as a heat map (unmethylated segments in dark blue, M-value = 6.00; highly methylated segments in dark red, M-value = –6.00). (B) Changes in global DNA methylation levels during PGC development. The M-value was calculated for each sample and is shown as a box plot. The bottom and top of the boxes are the 25th and 75th percentile, respectively.

