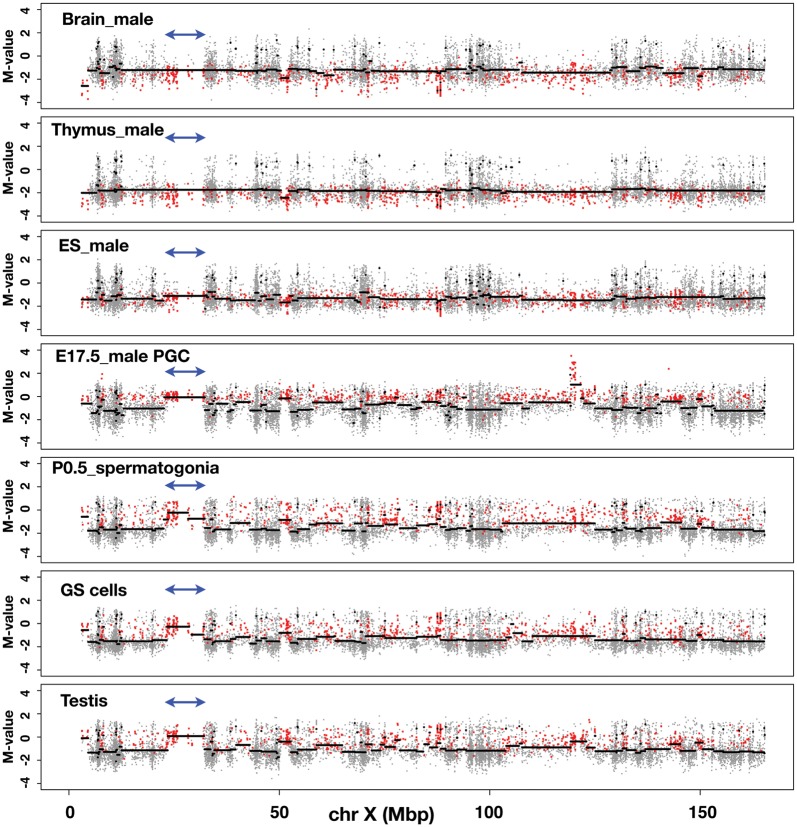
Figure 3.
Discovery of large, contiguous genomic regions with low DNA methylation modifications in male germ cells. The methylation profiles of genomic DNA along the mouse X chromosome. Samples used for the analysis are indicated in each figure. The M-value of each CCGG segment obtained from the analysis of each sample DNA is plotted on the mouse X chromosome (grey dots). The y-axis represents the M-value; log2(HpaII/MspI). The black line was drawn using DNAcopy, a circular binary segmentation programme obtained from http://www.bioconductor.org/packages/2.3/bioc/html/DNAcopy.html.32 Red dots represent CCGG segments belonging to Cluster 4. Double-headed arrows indicate the position of the Xmr gene cluster.

