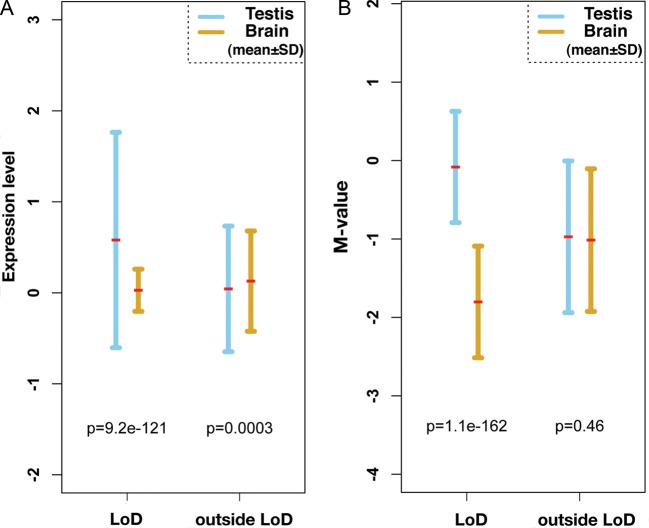
Figure 5.
Inverse relationship between DNA methylation and expression of genes within the LoDs. (A) A plot of the expression levels of genes contained in LoDs, and regions outside LoDs on the mouse X chromosome. Gene expression data were obtained from the Affymetrix Exon array data set.43 The expression values of exons contained in LoDs were averaged and plotted, and the data points from regions outside LoDs were similarly averaged. For statistical analysis of the data from regions outside LoDs, the same number of data points as those used to analyse within LoDs were randomly selected and used. (B) Mean methylation levels of genomic DNA within LoDs. The mean M-values from the CCGG segments contained in LoDs or in regions outside LoDs are shown. Statistical significance was tested by Wilcoxon t-test, and P-values are shown within the figures.

