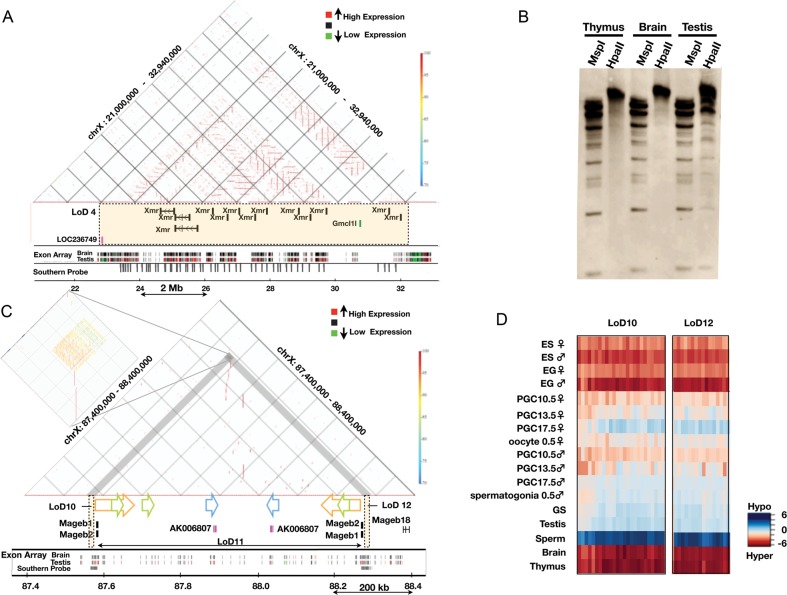
Figure 6.
Genomic structures of LoDs: Xmr and Mageb. (A) Genomic structure of LoD 4 (Xmr). The top section represents a similarity dot plot44 of LoD 4 and flanking regions (chrX: 21 000 000–32 940 000; UCSC mm8). Similarities of the sequences are colour-coded as shown by the colour bar on the right (high similarity in dark red, 100% similarity; low similarity in blue, 70% similarity). The horizontal lines represent direct repeats, and the vertical lines indicate IRs. The middle section depicts the locations of genes contained in LoD 4 (coloured rectangle). Exon array expression data for the brain and testis43 are shown at the bottom (high gene expression in red and low expression in green). The positions of sequences with homology to the Xmr cDNA probe are also shown by grey vertical bars (Southern probe). (B) Southern blot probed with the Xmr cDNA. Genomic DNAs from three organs were digested with either MspI or HpaII. Xmr cDNA probe (708 bp) was amplified from testis cDNA using primers, Xmr FW: 5′-AAGGGTGCAGTTGTGAAGGT-3′, Xmr Rv: 5′-TGTTGGTCTCCATGTTCATCA-3′. The hybridization signals in the unresolved part of the testis DNA blot are likely to reflect non-specific cross-hybridization. Southern blot analysis data using DNA doubly digested by BamHI plus either HpaII or MspI confirmed this notion (data not shown). (C) Genomic structure of LoDs 10, 11 and 12 (Mageb1/b2). Top: similarity dot plot. The vertical lines and coloured arrows indicate positions of IRs. The colouring of the similarities is the same as found in Fig. 6A. Homologous repeats are represented by the same colour. A magnified view of the IRs contained in LoDs 10 and 12 is presented on the left. Gene expression data for the brain and testis are shown at the bottom. The positions of sequences with homology to a probe used for Southern blot analysis (Fig. 4C and 4D) are shown by grey bars (Southern probe). (D) A DNA methylation heat map of LoDs 10 and 12. DNA methylation levels of the CCGG segments are represented as a heat map (unmethylated segments in dark blue, M-value = 6.00; highly methylated segments in dark red, M-value = –6.00).

