Figure 7.
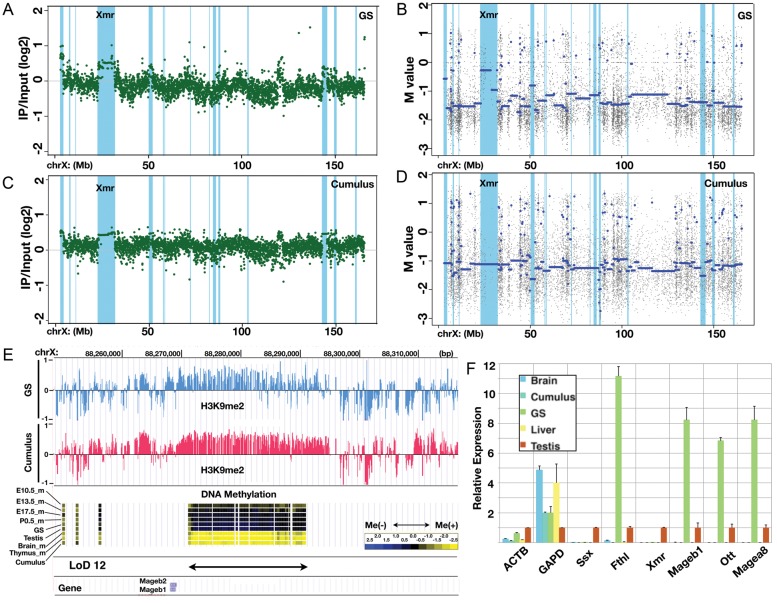
Large stretches of H3K9 dimethyl modifications overlapping LoDs. (A) ChIP-on-chip data for the H3K9me2 modification along the X chromosome in GS cells. The green dots represent individual probe data. The positions of LoDs are shown in light blue. (B) DNA methylation profile of GS cells within the X chromosome. The blue line denotes the average M-values. The positions of LoDs are shown in light blue. (C) ChIP-on-chip data for H3K9me2 modification along the X chromosome in cumulus cells. (D) The DNA methylation profile of cumulus cells within the X chromosome. (E) A magnified view of the LoD 12 region. Top, the H3K9me2 modification in GS cells (blue) and in cumulus cells (pink). Middle, DNA methylation data for E10.5 male PGCs, E13.5 male PGCs, E17.5 male PGCs, P0.5 spermatogonia, GS cells, testis, brain, thymus and cumulus cells. Bottom, positions of LoD and Mageb1/b2 genes. (F) Quantitative reverse transcription polymerase chain reaction (RT-PCR) expression analysis of genes in LoD regions. The Ssx9 (Ssx), Fthl17 (Fthl), Xmr, Mageb1, Ott and Magea8 genes are located within LoDs on the X chromosome. Beta-actin (ACTB) and Gapdh (GAPD) genes were also examined. The expression level in the testis is set at 1.0, and the expression levels in other cells and tissues (brain, cumulus cells, GS cells and liver) relative to that in the testis are shown. Primers used for this RT-PCR analysis are listed in Supplementary Table S4A.

