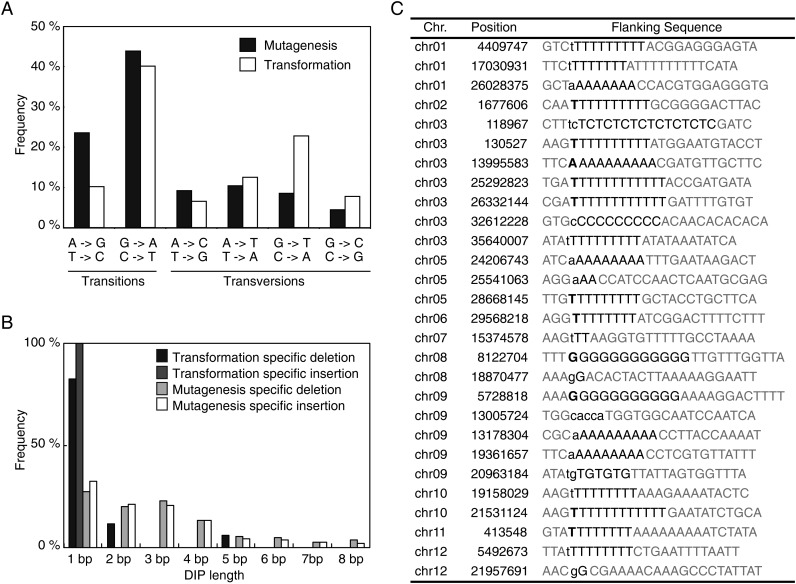
Figure 3.
Distribution of specific classes of mutation. (A) Distribution of specific classes of mutagenesis-specific (black) and transformation-specific (white) base substitution mutation. Y-axis indicates the ratio of the number of each type of base change to that of total base changes. (B) Distribution of sizes of transformation-specific deletions (black), transformation-specific insertions (dark gray), mutagenesis-specific deletions (light grey), and mutagenesis-specific insertions (white). Y-axis indicates the ratio of the number of each length of deletion or insertion to that of total deletion or insertion. (C) Transgenic-specific deletion and insertion mutations. Locations and flanking sequences are shown. Mono- or di-nucleotide context are highlighted by black letters. Lower case and bold letters indicate deletion and insertion, respectively.

