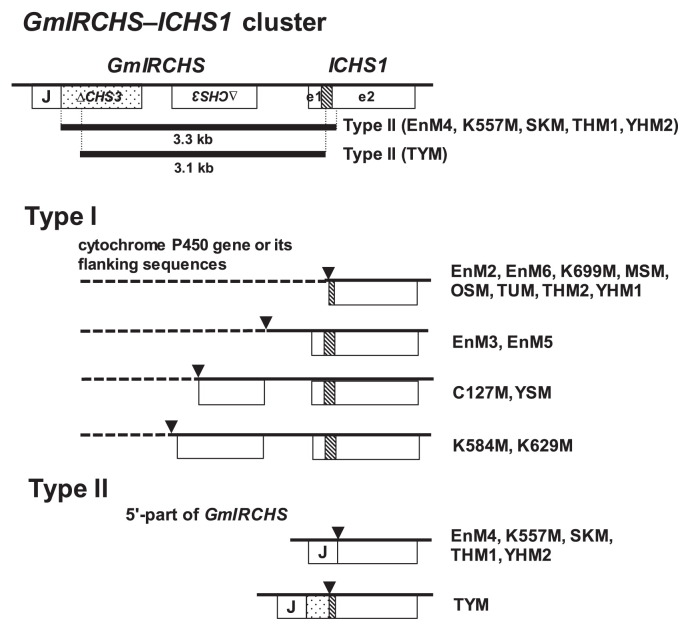
Fig. 4.
Schematic representation of the GmIRCHS–ICHS1 cluster in yellow soybean with the I/I genotype and the corresponding region in scp mutants (types I and II). Deleted regions in type II mutants are shown by bold lines. The stippled box indicates most of the exon2 region of pseudoCHS3. The shaded box, e1 and e2 denote an intron, exon1 and exon2 of ICHS1, respectively. Points of divergence are indicated by triangles. A cytochrome P450 gene or its flanking regions are indicated by dotted lines.

