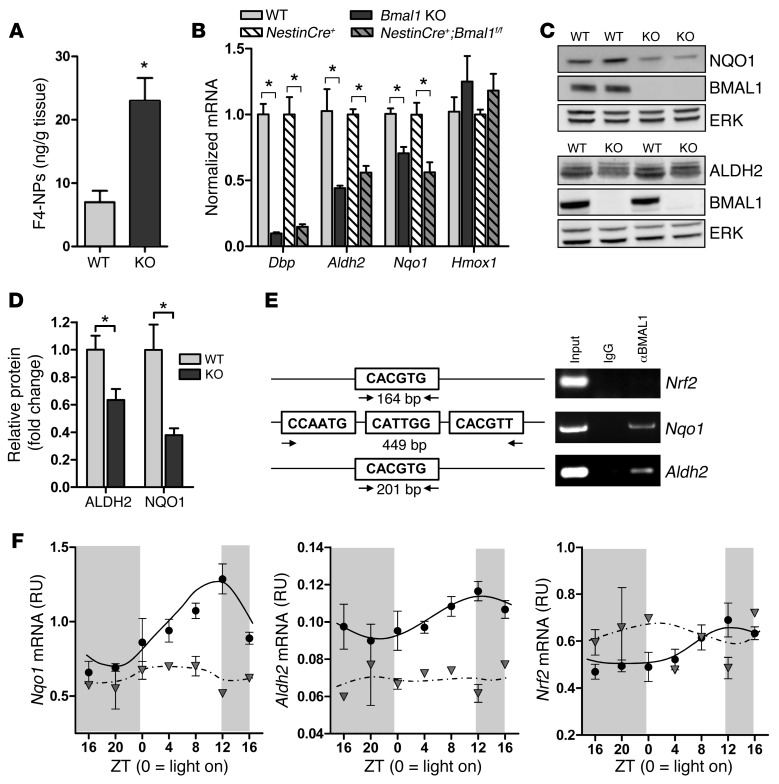
Figure 5. Bmal1 deletion induces oxidative stress and redox defense gene dysregulation.
(A) Increased F4-NP levels as quantified by liquid chromatography tandem mass spectrometry (LC-MS/MS) in 6-month-old Bmal1 KO cortex, indicative of neuronal membrane lipid peroxidation (n = 5 mice/genotype). (B) Quantification of Dbp and redox gene expression in Bmal1 KO and NestinCre+;Bmal1f/f cortex versus controls at ZT 6 (n = 5–6 mice/genotype). Bmal1 KO values were normalized and compared with WT cortex, while NestinCre+;Bmal1f/f values were normalized and compared with NestinCre+ controls. (C) Representative Western blots showing decreased NQO1 (upper blots) and ALDH2 (lower blots) protein in Bmal1 KO brain at ZT 6. ERK is shown as a loading control. (D) Quantification of ALDH2 and NQO1 protein (n = 5 mice/genotype). Shown is the mean + SEM for all graphs. *P < 0.05 versus control by Student’s t test (A) or 2-way ANOVA with Bonferroni’s post test (B and D). (E) ChIP assay in WT mice at ZT 6 demonstrating that BMAL1 does not bind to a canonical E-box in the Nrf2 promoter, but does bind a noncanonical E-box in the Nqo1 promoter and a canonical E-box in the Aldh2 promoter. Total lysate (input, positive control) and immunoprecipitates prepared using nonspecific IgG (negative control) are shown. (F) BMAL1 regulates cortical expression of Nqo1 and Aldh2, but not Nrf2. Frontal cortex samples were collected every 4 hours from Bmal1f/f control mice (black circles) or NestinCre+;Bmal1f/f mice (gray triangles) as in Figure 3D, and redox genes were quantified by qPCR (n = 2–3 mice/time point/genotype).

