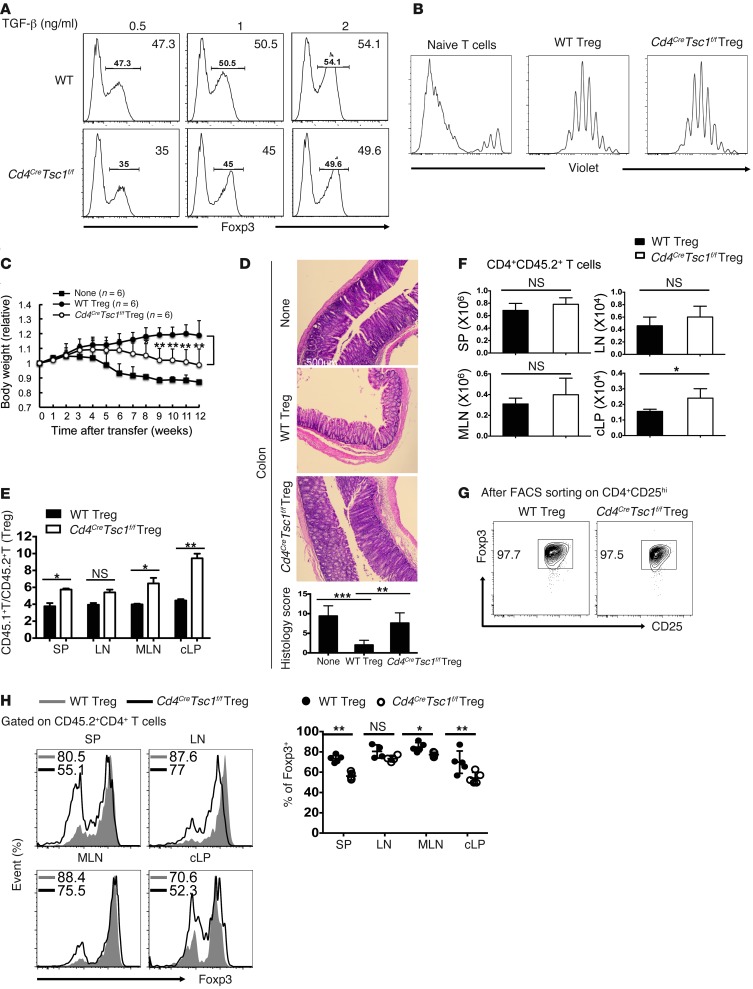
Figure 3. Treg cells from Cd4creTsc1f/f mice have a defect in colitis suppression.
(A) Sorted naive CD4+CD62L+CD25– T cells from WT and Cd4CreTsc1f/f mice were stimulated with anti-CD3/CD28 in the presence of the indicated concentrations of TGF-β. Induction of Foxp3+ Treg cells was examined by flow cytometry on day 4. (B) Cells in A were cocultured with Violet-labeled CD4+CD25– naive T cells at a 1:1 ratio in the presence of irradiated T cell–depleted splenocytes and anti-CD3. Violet dilution was assessed 4 days later by flow cytometry. Data are representative of three to five independent experiments (A and B). (C) Rag1–/– mice were given sorted WT or TSC1-deficient CD4+CD25+ (CD45.2+) Treg cells, together with CD4+CD45RBhi (CD45.1+) T cells or CD4+CD45RBhi (CD45.1+) T cells alone (None). Weight loss in individual mice was monitored every week for 12 weeks. (D–F) H&E staining and colon histological scores. Original magnification, ×100 (D); ratios of CD4+CD45RBhi (CD45.1+) to CD4+CD25+ (CD45.2+) Treg cells in the SP, LNs, MLNs, and cLP (E); absolute numbers of CD4+CD45.2+ T cells (F) in Rag1–/– recipient mice, as in C, 12 weeks after transfer. (G and H) Flow cytometric analysis of Foxp3+ expression in sorted CD4+CD45RBloCD25+ Treg cells before adoptive transfer (G) or 12 weeks after transfer (H) in Rag1–/– recipient mice, as in C. Data are compiled from (C, E, and F) or representative of (D and H) three independent experiments with two mice each. Error bars indicate the mean ± SD. *P < 0.05, **P < 0.01, and ***P < 0.001 by two-tailed, unpaired Student’s t test.

