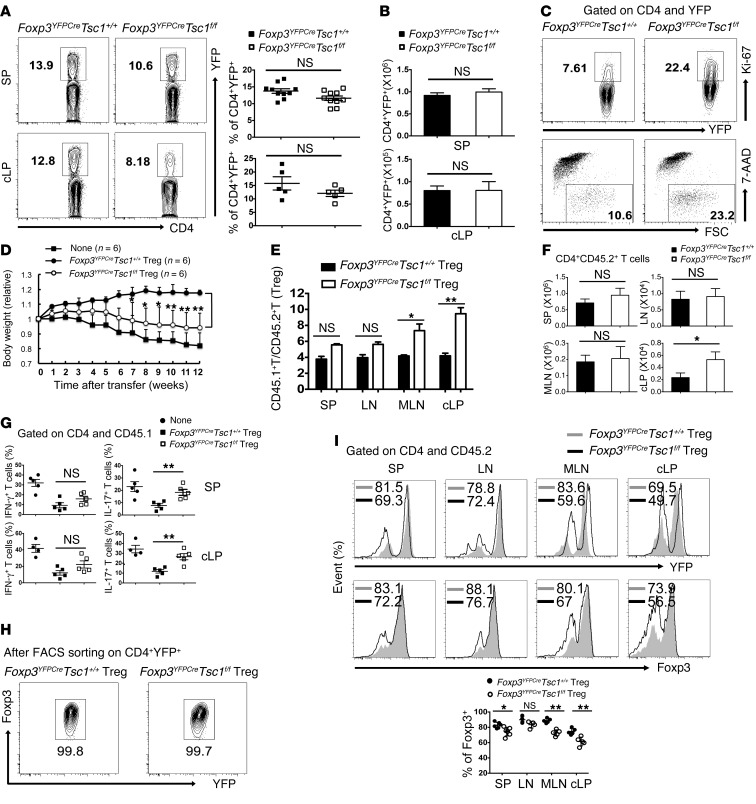
Figure 4. TSC1 deficiency in Foxp3+ Treg cells results in loss of Treg function under inflammatory condition.
(A and B) Flow cytometric analysis (left), frequencies (right) of YFP expression (A), and absolute numbers of CD4+YFP+ T cells (B) from spleen or cLP of Foxp3YFPCreTsc1+/+ and Foxp3YFPCreTsc1f/f mice. (C) Flow cytometric analysis of Ki-67 expression in CD4+YFP+T cells (upper panel) and 7-AAD staining in CD4+YFP+T cells 48 hours after anti-CD3/CD28 stimulation (lower panel) in Foxp3YFPCreTsc1+/+ and Foxp3YFPCreTsc1f/f mice. Data are representative of (A and C) or compiled from (B) three independent experiments. Error bars indicate the mean ± SD by two-tailed, unpaired Student’s t test. (D) Rag1–/– mice were given sorted CD4+YFP+ (CD45.2+) Treg cells from Foxp3YFPCreTsc1+/+ or Foxp3YFPCreTsc1f/f mice, together with CD4+CD45RBhi (CD45.1+) T cells, or CD4+CD45RBhi (CD45.1+) T cells alone (None). Weight loss of individual mice was monitored every week for 12 weeks. (E–G) Ratios of CD4+CD45RBhigh (CD45.1+) to CD4+YFP+ (CD45.2+) Treg cells in the SP, LNs, MLNs, and cLP (E); absolute numbers of CD4+CD45.2+ T (Treg) cells (F); frequencies of the indicated cytokine-producing CD4+CD45.1+ T cells in spleen and cLP (G) in Rag1–/– recipient mice as in D 12 weeks after transfer. (H and I) Flow cytometric analysis of Foxp3+ expression in sorted CD4+CD45RBloYFP+ Treg cells before adoptive transfer (H) or 12 weeks after transfer (I) in Rag1–/– recipient mice as in D. Data are compiled from (D–G) or representative of (I) three independent experiments with two mice each. Error bars indicate the mean ± SD. *P < 0.05 and **P < 0.01 by two-tailed, unpaired Student’s t test.

