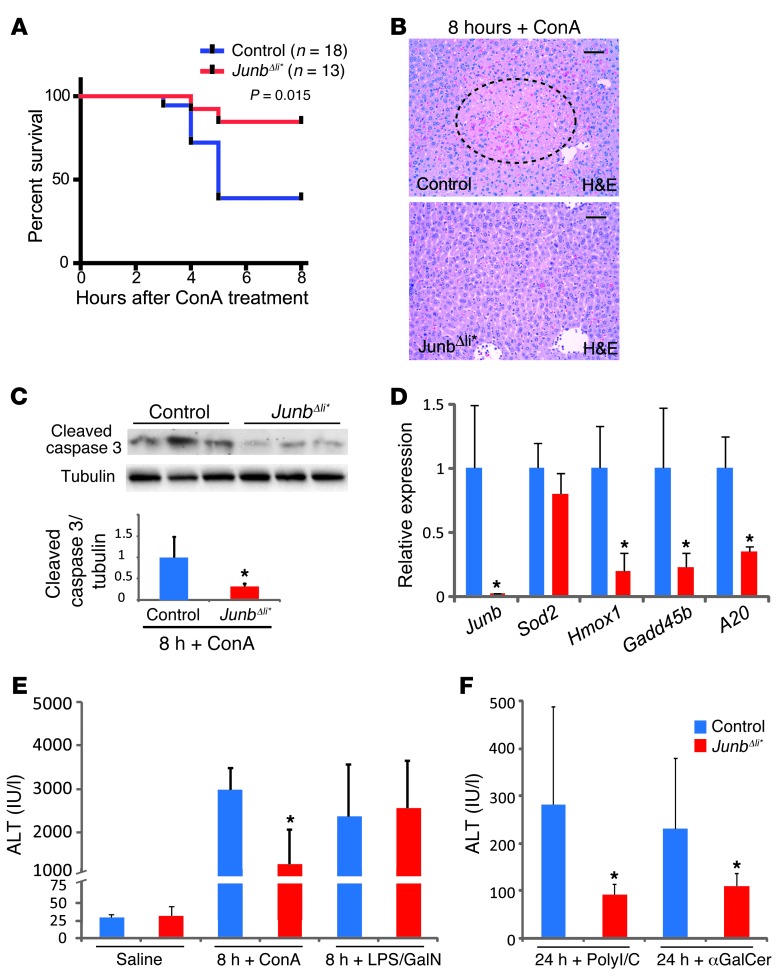
Figure 2. JunbΔli* mice are protected from liver damage upon ConA, αGalCer, and poly-I/C treatment.
(A) Survival of control and JunbΔli* mice after ConA injection (25 mg/kg, Kaplan-Meier curve). (B) H&E staining of liver sections 8 hours after ConA treatment. The dotted line marks an area of liver damage. One representative experiment is shown (n > 10). Scale bar: 50 μm. (C) Western blot for cleaved caspase-3 and quantification relative to tubulin (n = 5; *P < 0.05). (D) qRT-PCR for stress-related genes 8 hours after ConA treatment (n > 5; *P < 0.05). Serum ALT levels (E) 8 or (F) 24 hours after injection of saline, ConA, LPS/GalN, αGalCer, or poly-I/C, as indicated (n = 8–12 mice per group; *P < 0.05).

