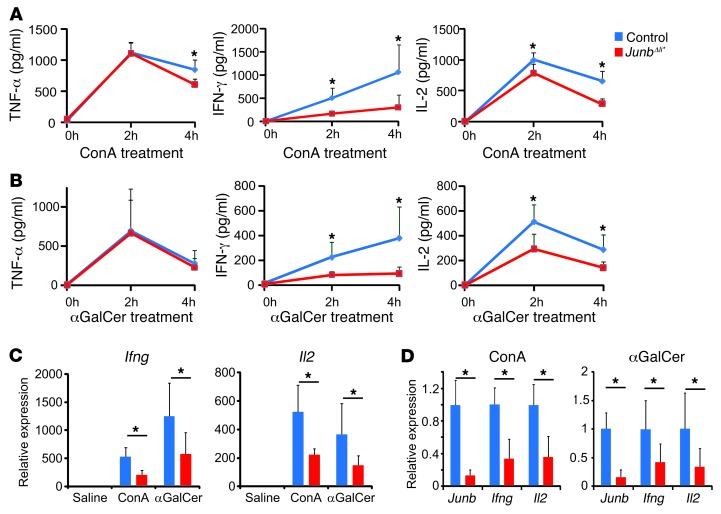
Figure 3. JunbΔli* mice have decreased cytokine levels.
(A) Serum cytokines in control and JunbΔli* mice at 0 (n = 3), 2 (n = 5), or 4 (n = 5) hours after ConA treatment. *P < 0.05. (B) Serum cytokines in control and JunbΔli* mice at 0 (n = 3), 2 (n = 6), or 4 (n = 6) hours after αGalCer treatment. *P < 0.05. (C) qRT-PCR for Ifng and Il2 in livers of control and JunbΔli* mice 2 hours after ConA or αGalCer treatment (n = 5; *P < 0.05). (D) qRT-PCR for Junb, Ifng, and Il2 in spleens of control and JunbΔli* mice 2 hours after ConA or αGalCer treatment (n = 5; *P < 0.05).

