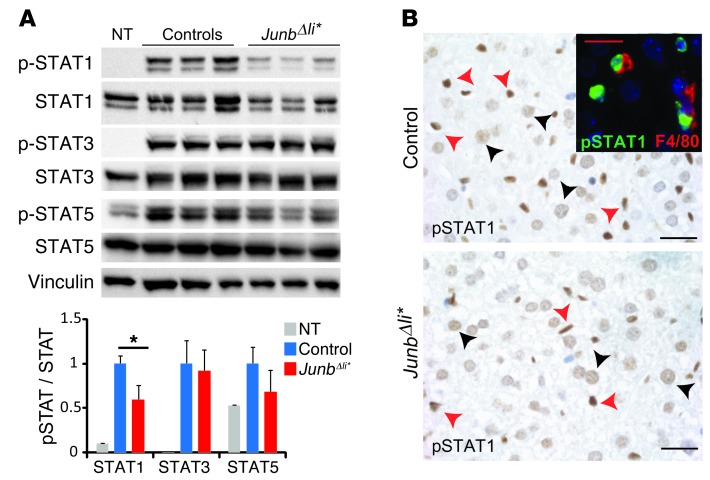
Figure 4. STAT1 pathway is altered in JunbΔli* mice.
Control and JunbΔli* mice were treated with ConA and liver samples analyzed. (A) Western blot for phosphorylated and total STAT1, STAT3, STAT5. Vinculin is included to control for equal loading. Quantification is shown (n = 5; *P < 0.05). (B) Liver sections stained for pSTAT1 (brown) after ConA treatment. Arrowheads indicate positive immune cells (red) and hepatocytes (black). n = 5. Immunofluorescence costaining of pSTAT1 (green) and F4/80 (red) is shown in the inset. A representative experiment is shown. Scale bar: 20 μm.

