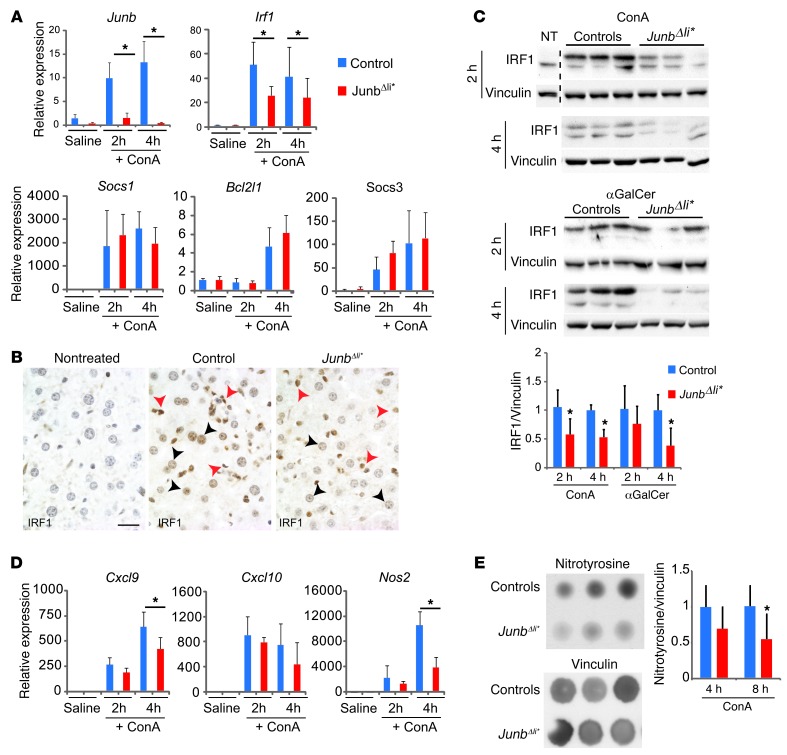
Figure 5. STAT1 targets, IRF1 and iNos, are altered in JunbΔli* mice.
Control and JunbΔli* mice were treated with ConA or αGalCer, and liver samples were analyzed. (A) qRT-PCR for Junb and STAT-regulated genes in the livers of saline-injected mice (n = 3) and in mice at 2 (n = 5) and 4 (n = 5) hours after ConA. *P < 0.05. (B) Liver sections stained for IRF1 (brown) in nontreated wild-type mice or 4 hours after ConA treatment of control and JunbΔli* mice. Arrowheads indicate positive immune cells (red) and hepatocytes (black). n = 3. A representative experiment is shown. Scale bar: 20 μm. (C) Western blot for IRF1 at 2 and 4 hours after treatment with either with ConA or αGalCer (aGal). The dotted line marks cropped samples. Vinculin is included to control for equal loading. Quantification is shown (n = 5–7; *P < 0.05). (D) qRT-PCR for Cxcl9, Cxcl10, and Nos2 in the livers of saline-injected mice (n = 3) and in mice at 2 (n = 5) and 4 (n = 5) hours after ConA treatment. *P < 0.05. (E) Dot blot for nitrosylated proteins (nitrotyrosine) 8 hours after ConA treatment. Vinculin is included to control for equal loading. Quantification is shown (n = 5; *P < 0.05).

