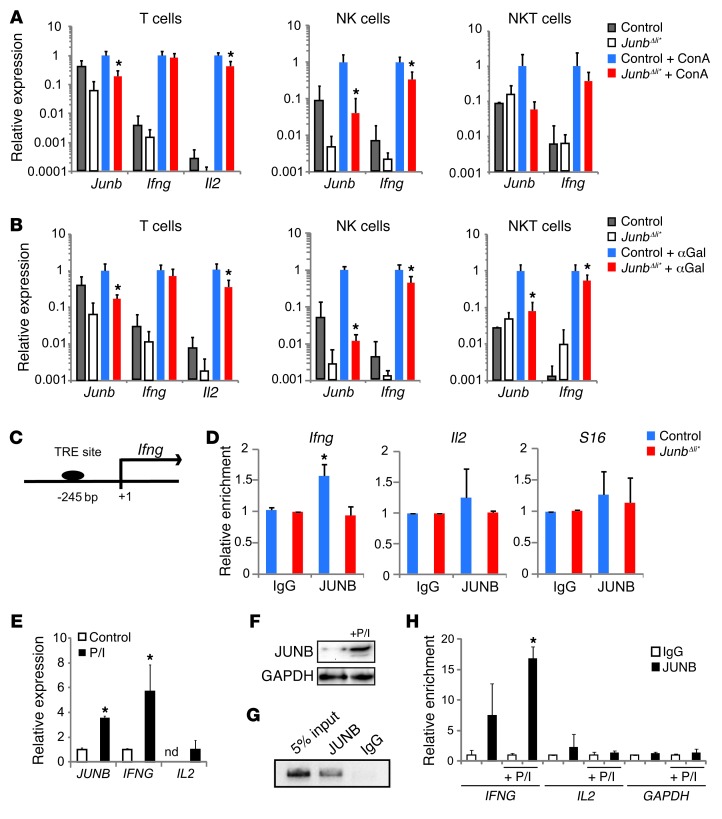
Figure 6. JUNB regulates IFN-γ in NK and NKT cells.
Control and JunbΔli* mice were treated with (A) ConA or (B) αGalCer (n = 5) or not treated (n = 3) for 2 hours, and T (CD3+, NK1.1–), NK (CD3–, NK1.1+), and NKT (CD3+, NK1.1+) cells were isolated from spleens by flow cytometry and analyzed by qRT-PCR for gene expression. *P < 0.05. (C) The human/mouse Ifng promoter. The position of the putative AP-1 binding TRE element included in the ChIP amplicon is indicated relative to the transcription start site. (D) Quantitative ChIP analysis of the Ifng, Il2, and S16 promoters in control and JunbΔli* livers after treatment with ConA using an antibody to JUNB or IgG. Input chromatin samples were run in parallel, and percentage of amplification relative to input for each antibody was quantified by qPCR and plotted (n = 3; *P < 0.05). Human YT NK cells were treated with P/I for 2 hours. (E) qRT-PCR expression of JUNB, IFNG, and IL2 (n = 3; *P < 0.05). (F) Western blot analysis of JUNB. (G) Representative agarose gel picture of end point PCR amplification for a ChIP of the IFNG promoter using an antibody to JUNB or IgG in YT cells. Input chromatin sample was run in parallel. (H) Quantitative ChIP analysis of the IFNG, IL2, and GAPDH promoters in untreated or P/I-stimulated YT cells using an antibody to JUNB or IgG. Input chromatin samples were run in parallel, and the percentage of amplification relative to input for each antibody was quantified by qPCR and plotted (n = 3; *P < 0.05).

