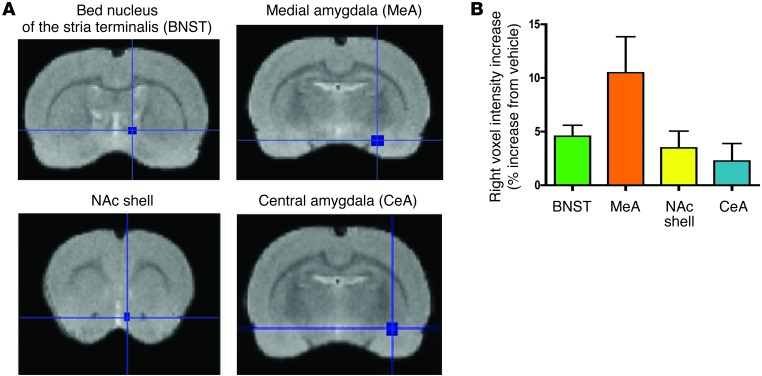
Figure 4. Voxel analysis of ExA substructures confirms increase of metabolic activity following PAC-Pdyn inhibition.
(A) Representative coronal images of ExA substructures analyzed for voxel analysis (B) Quantitative bar graphs of 3D voxel intensities in the right ExA substructures. Evaluation of each substructure demonstrated that CNO administration enhanced voxel intensity selectively in the right substructures as compared with vehicle administration. BNST, P = 0.002; NAc shell, P = 0.031; MeA, P = 0.008; CeA, P = 0.1, paired t test.

