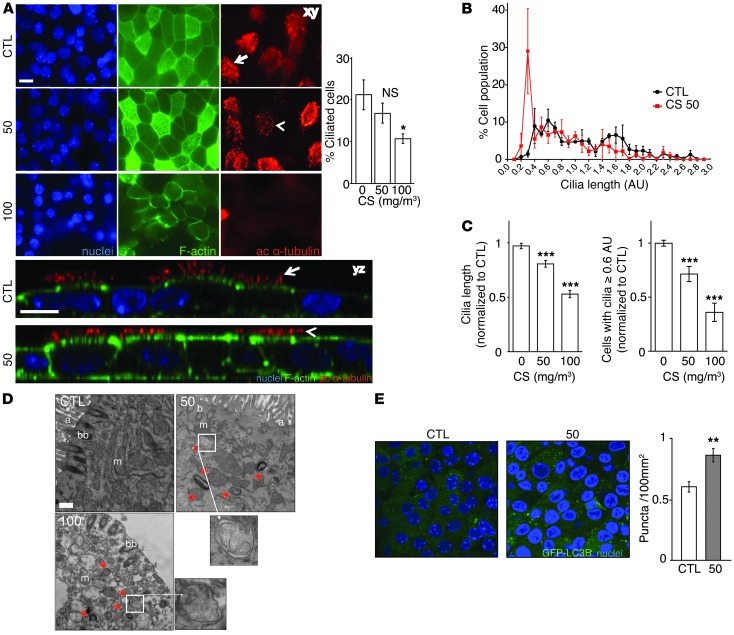
Figure 1. Cigarette smoke causes cilia loss and shortening and increased autophagy in primary cultured epithelial cells.
(A) Cells exposed to 50 or 100 mg/m3 were harvested 24 hours after exposure and analyzed for the cilia marker acetylated α-tubulin, F-actin, and Hoechst staining by confocal xy- or z-stack analysis. Scale bar: 10 μm. Arrows indicate intact cilia; arrowheads indicate shortened cilia. Dara are representative of three independent experiments. Quantification of ciliated cells (right) was performed based on the morphological appearance of acetylated α-tubulin–positive cells normalized to total nuclei. (B) Distribution of cilia lengths by SEM in MTECs 24 hours after exposure to 50 mg/m3 CS. Distributions were constructed by creating histograms from 0.2 AU bins, equally weighting each sample. (C) Average cilia length and change in the number of cells with cilia lengths of 0.6 AU or more in MTECs exposed to 50 or 100 mg/m3 CS. Cilia lengths were calculated from 10 SEM images/MTEC culture (n = 3). The number of MTECs with cilia lengths of 0.6 AU or more were calculated from 5 SEM images per sample (n = 4 cultures/group) normalized to controls. (D) Ciliated MTECs were analyzed for ultrastructural changes 24 hours after exposure to CS at the indicated doses. Red arrows indicate autophagosomes/autophagolysosomes. a, axoneme; bb, basal body; m, mitochondria. Scale bar: 500 nm. Image is representative of 45 images (n = 1 MTEC culture). (E) Autophagosome-associated GFP-LC3 puncta were imaged and quantified (right) by confocal microscopy in control- and CS-treated (50 mg/m3) MTECs (5 images/culture from 3 MTEC cultures). All data are the mean ± SEM. *P < 0.05, **P < 0.01, and ***P < 0.001 by one-way ANOVA followed by a Bonferroni’s post test.

