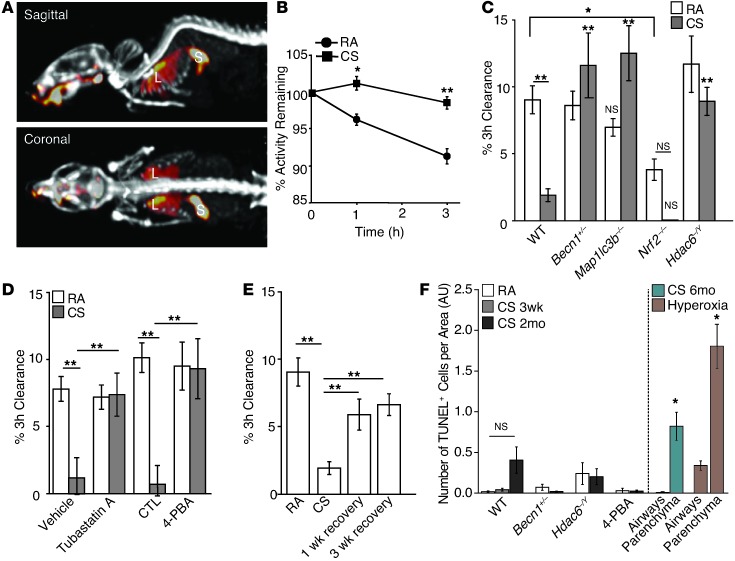
Figure 7. Targeting of MCC function by inhibition of HDAC6 or the autophagic pathway.
(A) Image of 99mTc-sc instilled into mouse lungs with skeleton visualized using 99mTc-mdp. Heatmap shows the distribution of 99mTc-sc in the lungs (L) and stomach (S). (B) 99mTc-sc in the lungs was quantified from images at t = 0, 1, and 3 hours in mice exposed to RA (n = 5) or CS (n = 5) for 3 weeks. (C) MCC was assessed after a 3-week exposure to RA or CS in Becn1+/– (n = 4/group), Map1lc3b–/– (n = 5–6/group), Nrf2–/– (n = 3–4/group), or Hdac6+/Y (n = 3–4/group) mice. (D) MCC was also assessed in mice coadministered with tubastatin A (n = 4/group) or with 4-PBA (n = 3–4/group) and a 3-week exposure to RA or CS. (E) MCC in mice exposed to RA or CS for 3 weeks (n = 10–13/group) or in mice exposed to CS for 3 weeks followed by a 1- or 3-week recovery period (n = 5/group). (F) TUNEL-positive cells in airways or parenchyma of WT mice (n = 3/group) exposed to RA or CS for 3 weeks, 2 months, or 6 months; in HDAC6–/Y or Becn1+/– mice exposed to CS for 2 months; or in mice treated with 4-PBA and exposed to 3 weeks of CS. Mice were exposed to hyperoxia or the corresponding RA control for 72 hours (far right) (7–10 images/mouse). All data are the mean ± SEM. (B) *P < 0.05, **P < 0.01 by an unpaired Student’s t test. (C–F) **P < 0.01 by one- or two-way ANOVA with Bonferroni’s post tests.

