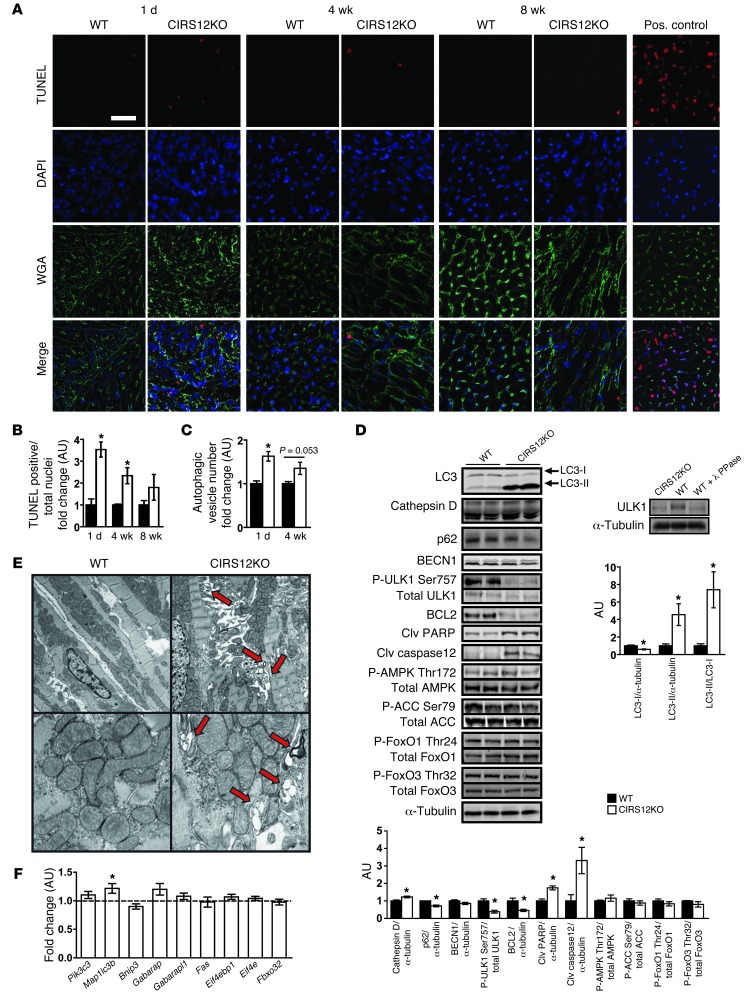
Figure 3. Increased autophagy and apoptosis in CIRS12KO hearts.
(A) Representative TUNEL, DAPI, and wheat germ agglutinin (WGA) staining and (B) stereological quantification (n = 3–4). Scale bar: 20 μm. (C) Autophagy quantified by cadaverine fluorescence staining of autophagosomes was increased by 63% and 35% at 1 day and 4 weeks of age, respectively (n = 6). (D) Representative Western blots and densitometric quantification for proteins involved in autophagy regulation and cell survival at 1 day of age (n = 3–6). Knockout of Irs1 and Irs2 resulted in a mobility shift of ULK1, which was also observed after phosphatase treatment of WT control, suggestive of impaired ULK1 phosphorylation in CIRS12KO hearts. (E) Representative electron micrographs from CIRS12KO and WT controls at 1 day of age showing increased formation of autophagosomes (arrows) in CIRS12KO hearts. Original magnification, ×5,000 (top); ×20,000 (bottom). (F) mRNA levels of genes involved in autophagy regulation and cell survival in 1-day-old CIRS12KO hearts (n = 6). Data are presented as fold change versus age-matched WT control (assigned as 1.0; dashed line) and normalized to Cphn. *P < 0.05 vs. WT same time point, unpaired Student’s t test. See Supplemental Table 11 for gene names.

