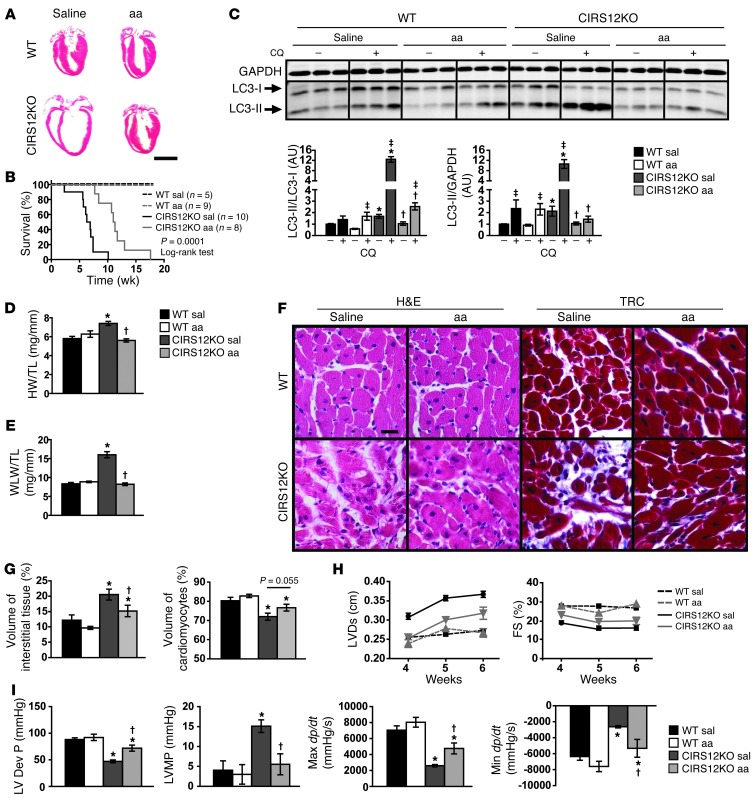
Figure 5. Decreased autophagy and attenuated heart failure by aa treatment in CIRS12KO mice.
(A) Representative H&E stains from WT and CIRS12KO hearts (6 weeks of age) after saline or aa treatment. Scale bar: 3 mm. (B) Survival curves showing that aa supplementation increased the average lifespan of CIRS12KO mice from 6.6 to 11.1 weeks (P = 0.0001, log-rank test). (C) Autophagy flux after chloroquine (CQ) injection (2 weeks of age), as measured by LC3 immunoblotting. (D) Heart weight/tibia length (HW/TL) and (E) wet lung weight/tibia length (WLW/TL) ratios after saline or aa treatment in 6-week-old mice. (F and G) Representative H&E and trichrome staining (F) and stereological analysis (G; n = 6–7). Scale bar: 20 μm. (H) Time course for LVDs and FS (n = 6–9). (I) Invasive measurement of LV pressures in WT and CIRS12KO hearts after saline or aa treatment at 6 weeks of age, as assessed by catheterization. LV Dev P, LV developed pressure; LVMP, LV minimum pressure; Max dP/dt and Min dP/dt, maximal rates of increase and decrease, respectively, in LV pressure. *P < 0.05 vs. WT same treatment, †P < 0.05 vs. saline same genotype, ‡P < 0.05 vs. same genotype no chloroquine, ANOVA with Fisher’s PLSD.

