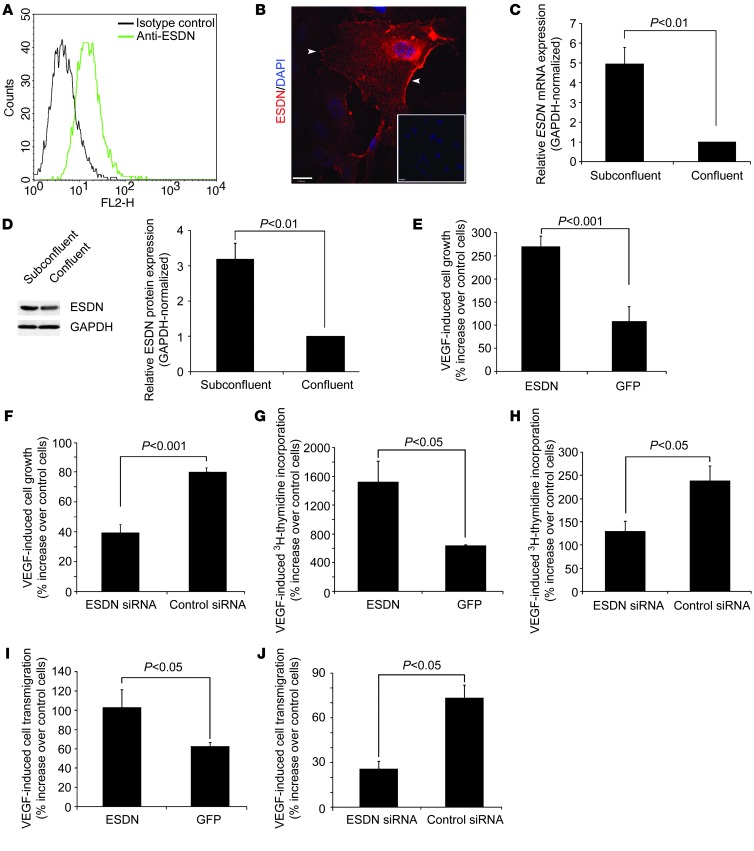
Figure 1. ESDN modulation of VEGF-induced HUVEC proliferation and migration.
(A and B) ESDN flow cytometry and immunofluorescence staining (in red). Arrowheads indicate ESDN expressed on EC membrane. Nuclei are stained with DAPI in blue. Inset: control staining. Scale bar: 20 μm. (C and D) GAPDH-normalized ESDN mRNA expression detected by real time RT-PCR (C, n = 3) and ESDN protein expression detected by Western blotting and its quantification (D, n = 3) in subconfluent and confluent ECs. (E and F) VEGF-induced EC growth monitored through MTT assay following ESDN (or GFP) overexpression (E) or siRNA-mediated ESDN downregulation (F). The data represent percent increase after 4 days relative to non-stimulated cells from three independent experiments. (G and H) VEGF-induced [3H]-thymidine incorporation following ESDN (or GFP) overexpression (G) or siRNA-mediated ESDN downregulation (H). The data represent percent increase relative to non-stimulated cells from 3 independent experiments. (I and J) VEGF-induced EC Transwell migration following ESDN (or GFP) overexpression (I) or siRNA-mediated ESDN downregulation (J). The data represent percentage increase relative to non-stimulated cells from 3 independent experiments.

